Nokia 2008 Annual Report Download - page 11
Download and view the complete annual report
Please find page 11 of the 2008 Nokia annual report below. You can navigate through the pages in the report by either clicking on the pages listed below, or by using the keyword search tool below to find specific information within the annual report.-
 1
1 -
 2
2 -
 3
3 -
 4
4 -
 5
5 -
 6
6 -
 7
7 -
 8
8 -
 9
9 -
 10
10 -
 11
11 -
 12
12 -
 13
13 -
 14
14 -
 15
15 -
 16
16 -
 17
17 -
 18
18 -
 19
19 -
 20
20 -
 21
21 -
 22
22 -
23
-
24
-
25
-
26
-
27
-
28
-
29
-
30
-
31
-
32
-
33
-
34
-
35
-
36
-
37
-
38
-
39
-
40
-
41
-
42
-
43
-
44
-
45
-
46
-
47
-
48
-
49
-
50
-
51
-
52
-
53
-
54
-
55
-
56
-
57
-
58
-
59
-
60
-
61
-
62
-
63
-
64
-
65
-
66
-
67
-
68
-
69
-
70
-
71
-
72
-
73
-
74
-
75
-
76
-
77
-
78
-
79
-
80
-
81
-
82
-
83
-
84
-
85
-
86
-
87
-
88
-
89
-
90
-
91
-
92
-
93
-
94
-
95
-
96
-
97
-
98
-
99
-
100
-
101
-
102
-
103
-
104
-
105
-
106
-
107
-
108
-
109
-
110
-
111
-
112
-
113
-
114
-
115
-
116
-
117
-
118
-
119
-
120
-
121
-
122
-
123
-
124
-
125
-
126
-
127
-
128
-
129
-
130
-
131
-
132
-
133
-
134
-
135
-
136
-
137
-
138
-
139
-
140
-
141
-
142
-
143
-
144
-
145
-
146
-
147
-
148
-
149
-
150
-
151
-
152
-
153
-
154
-
155
-
156
-
157
-
158
-
159
-
160
-
161
-
162
-
163
-
164
-
165
-
166
-
167
-
168
-
169
-
170
-
171
-
172
-
173
-
174
-
175
-
176
-
177
-
178
-
179
-
180
-
181
-
182
-
183
-
184
-
185
-
186
-
187
-
188
-
189
-
190
-
191
-
192
-
193
-
194
-
195
-
196
-
197
-
198
-
199
-
200
-
201
-
202
-
203
-
204
-
205
-
206
-
207
-
208
-
209
-
210
-
211
-
212
-
213
-
214
-
215
-
216
-
217
-
218
-
219
-
220
-
221
-
222
-
223
-
224
-
225
-
226
-
227
 |
 |

(1)
To be proposed by the Board of Directors for shareholders’ approval at the Annual General
Meeting convening on April 23, 2009.
(2)
The final US dollar amount will be determined on the basis of the decision of the Annual General
Meeting and the dividend payment date.
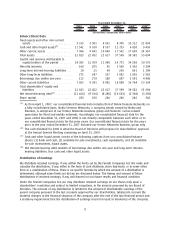
We make our cash dividend payments in euro. As a result, exchange rate fluctuations will affect the
US dollar amount received by holders of ADSs on conversion of these dividends. Moreover, fluctuations
in the exchange rates between the euro and the US dollar will affect the dollar equivalent of the euro
price of the shares on NASDAQ OMX Helsinki and, as a result, are likely to affect the market price of
the ADSs in the United States. See also Item 3D. “Risk Factors—Our sales, costs and results of
operations, as well as the US dollar value of our dividends and market price of our ADSs, are affected
by exchange rate fluctuations, particularly between the euro, which is our reporting currency, and the
US dollar, the Japanese yen, the Chinese yuan and the UK pound sterling, as well as certain other
currencies.”
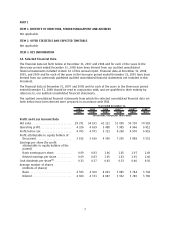
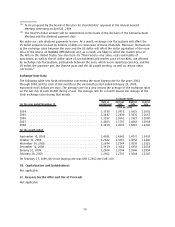
Exchange Rate Data
The following table sets forth information concerning the noon buying rate for the years 2004
through 2008 and for each of the months in the sixmonth period ended February 28, 2009,
expressed in US dollars per euro. The average rate for a year means the average of the exchange rates
on the last day of each month during a year. The average rate for a month means the average of the
daily exchange rates during that month.
For the year ended December 31:
Rate at
period end
Average
rate
Highest
rate
Lowest
rate
Exchange Rates
(USD per EUR)
2004 ............................................. 1.3538 1.2478 1.3625 1.1801
2005 ............................................. 1.1842 1.2400 1.3476 1.1667
2006 ............................................. 1.3197 1.2661 1.3327 1.1860
2007 ............................................. 1.4603 1.3797 1.4862 1.2904
2008 ............................................. 1.3919 1.4695 1.6010 1.2446
For the month ended:
September 30, 2008 ................................ 1.4081 1.4342 1.4737 1.3939
October 31, 2008 ................................... 1.2682 1.3267 1.4058 1.2446
November 30, 2008 ................................. 1.2694 1.2744 1.3039 1.2525
December 31, 2008 ................................. 1.3919 1.3511 1.4358 1.2634
January 31, 2009 ................................... 1.2804 1.3244 1.3946 1.2804
February 28, 2009 .................................. 1.2662 1.2797 1.3064 1.2547
On February 27, 2009, the noon buying rate was USD 1.2662 per EUR 1.00.
3B. Capitalization and Indebtedness
Not applicable.
3C. Reasons for the Offer and Use of Proceeds
Not applicable.
10