Nokia 2008 Annual Report Download - page 121
Download and view the complete annual report
Please find page 121 of the 2008 Nokia annual report below. You can navigate through the pages in the report by either clicking on the pages listed below, or by using the keyword search tool below to find specific information within the annual report.-
 1
1 -
2
-
3
-
4
-
5
-
6
-
7
-
8
-
9
-
10
-
11
-
12
-
13
-
14
-
15
-
16
-
17
-
18
-
19
-
20
-
21
-
22
-
23
-
24
-
25
-
26
-
27
-
28
-
29
-
30
-
31
-
32
-
33
-
34
-
35
-
36
-
37
-
38
-
39
-
40
-
41
-
42
-
43
-
44
-
45
-
46
-
47
-
48
-
49
-
50
-
51
-
52
-
53
-
54
-
55
-
56
-
57
-
58
-
59
-
60
-
61
-
62
-
63
-
64
-
65
-
66
-
67
-
68
-
69
-
70
-
71
-
72
-
73
-
74
-
75
-
76
-
77
-
78
-
79
-
80
-
81
-
82
-
83
-
84
-
85
-
86
-
87
-
88
-
89
-
90
-
91
-
92
-
93
-
94
-
95
-
96
-
97
-
98
-
99
-
100
-
101
-
102
-
103
-
104
-
105
-
106
-
107
-
108
-
109
-
110
-
 111
111 -
 112
112 -
 113
113 -
 114
114 -
 115
115 -
 116
116 -
 117
117 -
 118
118 -
 119
119 -
 120
120 -
 121
121 -
 122
122 -
 123
123 -
 124
124 -
 125
125 -
 126
126 -
 127
127 -
 128
128 -
 129
129 -
 130
130 -
 131
131 -
132
-
133
-
134
-
135
-
136
-
137
-
138
-
139
-
140
-
141
-
142
-
143
-
144
-
145
-
146
-
147
-
148
-
149
-
150
-
151
-
152
-
153
-
154
-
155
-
156
-
157
-
158
-
159
-
160
-
161
-
162
-
163
-
164
-
165
-
166
-
167
-
168
-
169
-
170
-
171
-
172
-
173
-
174
-
175
-
176
-
177
-
178
-
179
-
180
-
181
-
182
-
183
-
184
-
185
-
186
-
187
-
188
-
189
-
190
-
191
-
192
-
193
-
194
-
195
-
196
-
197
-
198
-
199
-
200
-
201
-
202
-
203
-
204
-
205
-
206
-
207
-
208
-
209
-
210
-
211
-
212
-
213
-
214
-
215
-
216
-
217
-
218
-
219
-
220
-
221
-
222
-
223
-
224
-
225
-
226
-
227
 |
 |

Plan Name
(1)
Number of
Performance
Shares at
Threshold
(2)
Number of
Performance
Shares at
Maximum
(2)
Intrinsic Value
December 31,
2008
(3)
(EUR)
Plan
Name
(4)
Number of
Restricted
Shares
Intrinsic Value
December 31,
2008
(5)
(EUR)
Tero Ojanpera
¨.......... 2005 10 000 21 200 235 320 2005
2006 15 000 29 700 329 670 2006 15 000 166 500
2007 16 000 64 000 0 2007 25 000 277 500
2008 10 000 40 000 0 2008 14 000 155 400
Niklas Savander ......... 2005 3 500 7 420 82 362 2005
2006 15 000 29 700 329 670 2006 15 000 166 500
2007 16 000 64 000 0 2007 25 000 277 500
2008 14 000 56 000 0 2008 20 000 222 000
Rick Simonson .......... 2005 15 000 31 800 352 980 2005
2006 25 000 49 500 549 450 2006 25 000 277 500
2007 27 500 110 000 0 2007 35 000 388 500
2008 16 000 64 000 0 2008 22 000 244 200
Veli Sundba
¨ck .......... 2005 10 000 21 200 235 320 2005
2006 15 000 29 700 329 670 2006 15 000 166 500
2007 16 000 64 000 0 2007 25 000 277 500
Anssi Vanjoki ........... 2005 15 000 31 800 352 980 2005
2006 25 000 49 500 549 450 2006 25 000 277 500
2007 27 500 110 000 0 2007 35 000 388 500
2008 16 000 64 000 0 2008 22 000 244 200
Kai O
¨ista
¨mo
¨............ 2005 3 200 6 784 75 302 2005
2006 25 000 49 500 549 450 2006 25 000 277 500
2007 27 500 110 000 0 2007 35 000 388 500
2008 16 000 64 000 0 2008 22 000 244 200
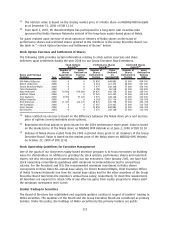
Performance Shares and
Restricted Shares held by
the Group Executive
Board, Total
(6)
......... 861400 2650324 9016796 964500 10705950
All outstanding Performance
Shares and Restricted
Shares (Global plans),
Total ............... 8596496 33607752 176418521 8049397 89348307
(1)
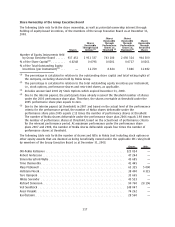
The performance period for the 2005 plan is 20052008, with one interim measurement period
for fiscal years 20052006. The performance period for the 2006 plan is 20062008, 2007 plan
20072009 and 2008 plan 20082010, respectively.
(2)
The threshold number will vest as Nokia shares should the predetermined threshold performance
levels of Nokia be met. Under the 2005 performance share plan, the participants have already
received the threshold number of Nokia shares in connection with the interim payout. The
maximum number of Nokia shares will vest should the predetermined maximum performance
levels be met. The maximum number of performance shares equals four times the number at
threshold. The number of Nokia shares deliverable under the performance share plan 2005 equals
2.12 times the number of performance shares at threshold due to the interim payout (at
threshold) in 2007 and based on the actual level of the performance criteria for the performance
period. Under the performance share plan 2006 the maximum number of Nokia shares deliverable
equals 1.98 times the number of performance shares at threshold.
(3)
The intrinsic value is based on the closing market price of a Nokia share on NASDAQ OMX Helsinki
as at December 31, 2008 of EUR 11.10. For performance share plans 2007 and 2008, the value of
performance shares is presented on the basis of Nokia’s estimation of the number of shares
expected to vest. For performance share plans 2005 and 2006, the value of performance shares is
presented on the basis of actual number of shares to vest.
(4)
Under the restricted share plans 2005, 2006, 2007 and 2008, awards have been granted quarterly.
For the major part of the awards made under these plans, the restriction period ended for the
2005 plan on October 1, 2008; and will end for the 2006 plan on October 1, 2009; for the 2007
plan, on October 1, 2010; and for the 2008 plan, on October 1, 2011.
120