Nokia 2008 Annual Report Download - page 86
Download and view the complete annual report
Please find page 86 of the 2008 Nokia annual report below. You can navigate through the pages in the report by either clicking on the pages listed below, or by using the keyword search tool below to find specific information within the annual report.-
 1
1 -
2
-
3
-
4
-
5
-
6
-
7
-
8
-
9
-
10
-
11
-
12
-
13
-
14
-
15
-
16
-
17
-
18
-
19
-
20
-
21
-
22
-
23
-
24
-
25
-
26
-
27
-
28
-
29
-
30
-
31
-
32
-
33
-
34
-
35
-
36
-
37
-
38
-
39
-
40
-
41
-
42
-
43
-
44
-
45
-
46
-
47
-
48
-
49
-
50
-
51
-
52
-
53
-
54
-
55
-
56
-
57
-
58
-
59
-
60
-
61
-
62
-
63
-
64
-
65
-
66
-
67
-
68
-
69
-
70
-
71
-
72
-
73
-
74
-
75
-
 76
76 -
 77
77 -
 78
78 -
 79
79 -
 80
80 -
 81
81 -
 82
82 -
 83
83 -
 84
84 -
 85
85 -
 86
86 -
 87
87 -
 88
88 -
 89
89 -
 90
90 -
 91
91 -
 92
92 -
 93
93 -
 94
94 -
 95
95 -
 96
96 -
97
-
98
-
99
-
100
-
101
-
102
-
103
-
104
-
105
-
106
-
107
-
108
-
109
-
110
-
111
-
112
-
113
-
114
-
115
-
116
-
117
-
118
-
119
-
120
-
121
-
122
-
123
-
124
-
125
-
126
-
127
-
128
-
129
-
130
-
131
-
132
-
133
-
134
-
135
-
136
-
137
-
138
-
139
-
140
-
141
-
142
-
143
-
144
-
145
-
146
-
147
-
148
-
149
-
150
-
151
-
152
-
153
-
154
-
155
-
156
-
157
-
158
-
159
-
160
-
161
-
162
-
163
-
164
-
165
-
166
-
167
-
168
-
169
-
170
-
171
-
172
-
173
-
174
-
175
-
176
-
177
-
178
-
179
-
180
-
181
-
182
-
183
-
184
-
185
-
186
-
187
-
188
-
189
-
190
-
191
-
192
-
193
-
194
-
195
-
196
-
197
-
198
-
199
-
200
-
201
-
202
-
203
-
204
-
205
-
206
-
207
-
208
-
209
-
210
-
211
-
212
-
213
-
214
-
215
-
216
-
217
-
218
-
219
-
220
-
221
-
222
-
223
-
224
-
225
-
226
-
227
 |
 |
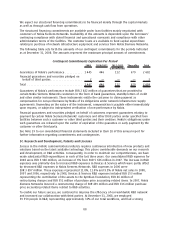
payment to Qualcomm pursuant to the new license agreement, increase in net working capital and
lower operating profitability, partly offset by an increase in shortterm and longterm borrowings
incurred in addition to the financing of the NAVTEQ acquisition. At December 31, 2006, cash and other
liquid assets totaled EUR 8 537 million.
Cash and cash equivalents decreased to EUR 5 548 million compared with EUR 6 850 million at
December 31, 2007, primarily as a result of the cash portion of NAVTEQ’s purchase price, Qualcomm
lumpsum cash payment, increase in net working capital and lower operating profitability, partly
offset by sale of investments and liquid assets and the increase in shortterm and longterm
borrowings incurred in addition to the financing of the NAVTEQ acquisition. We hold our cash and
cash equivalents predominantly in euros. Cash and cash equivalents totaled EUR 3 525 million at
December 31, 2006.
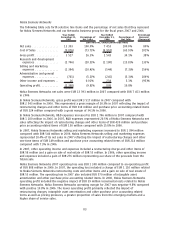
Net cash from operating activities was EUR 3 197 million in 2008 compared with EUR 7 882 million in
2007, and EUR 4 478 million in 2006. In 2008, net cash from operating activities decreased primarily
due to decreased profitability, an increase in net working capital, Qualcomm lumpsum cash payment
and an increase in income taxes paid. In 2007, net cash from operating activities increased primarily
due to an increase in cash generated from operations partly offset by increased income taxes paid.
Net cash used in investing activities was EUR 2 905 million in 2008 compared with EUR 710 million in
2007, and net cash from investing activities of EUR 1 006 million in 2006. Net cash used in acquisitions
of group companies, net of acquired cash, was EUR 5 962 million in 2008 compared with
EUR 253 million net cash from acquisitions of group companies due to acquired cash in an otherwise
noncash transaction in 2007 and net cash used in acquisitions of group companies of EUR 517 million
in 2006. Cash flow from investing activities in 2008 included purchases of current availableforsale
investments, liquid assets of EUR 669 million, compared with EUR 4 798 million in 2007 and
EUR 3 219 million in 2006. Additions to capitalized R&D expenses totaled EUR 131 million, compared
with EUR 157 million in 2007 and EUR 127 million in 2006. In 2008, we had no longterm loans made
to customers, compared with longterm loans made to customers of EUR 261 million in 2007 and
EUR 11 million in 2006. Net cash from investing activities in 2006 included EUR 276 million relating to
recovery of impaired longterm loans made to customers. Capital expenditures for 2008 were
EUR 889 million compared with EUR 715 million in 2007 and EUR 650 million in 2006. Major items of
capital expenditure included production lines, test equipment and computer hardware used primarily in
research and development, office and manufacturing facilities as well as services and software related
intangible assets. Proceeds from maturities and sale of current availableforsale investments, liquid
assets, decreased to EUR 4 664 million, compared with EUR 4 930 million in 2007, and
EUR 5 058 million in 2006.
Net cash used in financing activities decreased to EUR 1 545 million in 2008 compared with
EUR 3 832 million in 2007, primarily as a result of an increase in proceeds from shortterm
borrowings. Net cash used in financing activities decreased to EUR 3 832 million in 2007 compared
with EUR 4 966 million in 2006, primarily as a result of an increase in proceeds from stock options
exercises of EUR 941 million and in proceeds from shortterm borrowings of EUR 798 million offset by
an increase in the purchases of treasury shares with EUR 448 million during 2007. Dividends paid
increased to EUR 2 048 million in 2008 compared with EUR 1 760 million in 2007 and
EUR 1 553 million in 2006.
At December 31, 2008, we had EUR 861 million in longterm interestbearing liabilities and
EUR 3 591 million in shortterm borrowings, offset by EUR 6 820 million in cash and other liquid
assets, resulting in a net liquid assets balance of EUR 2 368 million, compared with
EUR 10 663 million at the end of 2007 and EUR 8 288 million at the end of 2006. The decrease
reflected the impact of the cash portion of NAVTEQ’s purchase price, Qualcomm lumpsum cash
payment, increase in net working capital and lower operating profitability. For further information
regarding our longterm liabilities, see Note 23 to our consolidated financial statements included in
Item 18 of this annual report. Our ratio of net interestbearing debt, defined as shortterm and long
term debt less cash and other liquid assets, to equity, defined as shareholders’ equity and minority
85