Nokia 2008 Annual Report Download - page 200
Download and view the complete annual report
Please find page 200 of the 2008 Nokia annual report below. You can navigate through the pages in the report by either clicking on the pages listed below, or by using the keyword search tool below to find specific information within the annual report.-
 1
1 -
 2
2 -
 3
3 -
 4
4 -
 5
5 -
 6
6 -
 7
7 -
 8
8 -
 9
9 -
 10
10 -
 11
11 -
 12
12 -
 13
13 -
 14
14 -
 15
15 -
 16
16 -
 17
17 -
 18
18 -
 19
19 -
 20
20 -
 21
21 -
 22
22 -
 23
23 -
 24
24 -
 25
25 -
 26
26 -
 27
27 -
 28
28 -
 29
29 -
 30
30 -
 31
31 -
 32
32 -
 33
33 -
 34
34 -
 35
35 -
 36
36 -
 37
37 -
 38
38 -
 39
39 -
 40
40 -
 41
41 -
 42
42 -
 43
43 -
 44
44 -
 45
45 -
 46
46 -
 47
47 -
 48
48 -
 49
49 -
 50
50 -
 51
51 -
 52
52 -
 53
53 -
 54
54 -
 55
55 -
 56
56 -
 57
57 -
 58
58 -
 59
59 -
 60
60 -
 61
61 -
 62
62 -
 63
63 -
 64
64 -
 65
65 -
 66
66 -
 67
67 -
 68
68 -
 69
69 -
 70
70 -
 71
71 -
 72
72 -
 73
73 -
 74
74 -
 75
75 -
 76
76 -
 77
77 -
 78
78 -
 79
79 -
 80
80 -
 81
81 -
 82
82 -
 83
83 -
 84
84 -
 85
85 -
 86
86 -
 87
87 -
 88
88 -
 89
89 -
 90
90 -
 91
91 -
 92
92 -
 93
93 -
 94
94 -
 95
95 -
 96
96 -
 97
97 -
 98
98 -
 99
99 -
 100
100 -
 101
101 -
 102
102 -
 103
103 -
 104
104 -
 105
105 -
 106
106 -
 107
107 -
 108
108 -
 109
109 -
 110
110 -
 111
111 -
 112
112 -
 113
113 -
 114
114 -
 115
115 -
 116
116 -
 117
117 -
 118
118 -
 119
119 -
 120
120 -
 121
121 -
 122
122 -
 123
123 -
 124
124 -
 125
125 -
 126
126 -
 127
127 -
 128
128 -
 129
129 -
 130
130 -
 131
131 -
 132
132 -
 133
133 -
 134
134 -
 135
135 -
 136
136 -
 137
137 -
 138
138 -
 139
139 -
 140
140 -
 141
141 -
 142
142 -
 143
143 -
 144
144 -
 145
145 -
 146
146 -
 147
147 -
 148
148 -
 149
149 -
 150
150 -
 151
151 -
 152
152 -
 153
153 -
 154
154 -
 155
155 -
 156
156 -
 157
157 -
 158
158 -
 159
159 -
 160
160 -
 161
161 -
 162
162 -
 163
163 -
 164
164 -
 165
165 -
 166
166 -
 167
167 -
 168
168 -
 169
169 -
 170
170 -
 171
171 -
 172
172 -
 173
173 -
 174
174 -
 175
175 -
 176
176 -
 177
177 -
 178
178 -
 179
179 -
 180
180 -
 181
181 -
 182
182 -
 183
183 -
 184
184 -
 185
185 -
 186
186 -
 187
187 -
 188
188 -
 189
189 -
 190
190 -
 191
191 -
 192
192 -
 193
193 -
 194
194 -
 195
195 -
 196
196 -
 197
197 -
 198
198 -
 199
199 -
 200
200 -
 201
201 -
 202
202 -
 203
203 -
 204
204 -
 205
205 -
 206
206 -
 207
207 -
 208
208 -
 209
209 -
 210
210 -
 211
211 -
 212
212 -
 213
213 -
 214
214 -
 215
215 -
 216
216 -
 217
217 -
 218
218 -
 219
219 -
 220
220 -
 221
221 -
 222
222 -
 223
223 -
 224
224 -
 225
225 -
 226
226 -
 227
227
 |
 |

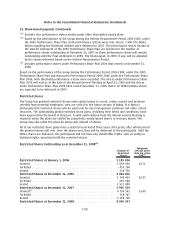
22. Sharebased payment (Continued)
Total stock options outstanding as at December 31, 2008
(1)
Number of shares
Weighted average
exercise price
EUR
(2)
Weighted
average share
price EUR
(2)
Shares under option at January 1, 2006....... 145 731 886 22.97
Granted................................... 11421939 16.79
Exercised ................................. 3302437 13.71 16.70
Forfeited .................................. 2888474 15.11
Expired ................................... 57677685 33.44
Shares under option at December 31, 2006.... 93 285 229 16.28
Granted................................... 3211965 18.48
Exercised ................................. 57776205 16.99 21.75
Forfeited .................................. 1992666 15.13
Expired ................................... 1161096 17.83
Shares under option at December 31, 2007.... 35 567 227 15.28
Granted................................... 3767163 17.44
Exercised ................................. 3657985 14.21 22.15
Forfeited .................................. 783557 16.31
Expired ................................... 11078983 14.96
Shares under option at December 31, 2008.... 23 813 865 15.89
Options exercisable at December 31, 2005
(shares) ................................. 112095407 25.33
Options exercisable at December 31, 2006
(shares) ................................. 69721916 16.65
Options exercisable at December 31, 2007
(shares) ................................. 21535000 14.66
Options exercisable at December 31, 2008
(shares) ................................. 12 895 057 14.77
(1)
Includes also stock options granted under other than global equity plans. For further information
see “Other equity plans for employees” below.
(2)
The weighted average exercise price and the weighted average share price do not incorporate the
effect of transferable stock option exercises by option holders not employed by the Group.
The weighted average grant date fair value of stock options granted was EUR 3.92 in 2008, EUR 3.24
in 2007, and EUR 3.31 in 2006.
The options outstanding by range of exercise price at December 31, 2008 are as follows:
Exercise prices EUR Number of shares
Weighted average
remaining
contractual life
in years
Weighted
average
exercise
price EUR
Options outstanding
2.1512.43 .................................. 4555378 1.78 11.50
12.7915.38 .................................. 5556538 2.06 13.00
17.0018.39 .................................. 10605500 3.28 18.11
19.1631.03 .................................. 3096449 4.43 19.93
23 813 865
F56
Notes to the Consolidated Financial Statements (Continued)
