Nokia 2008 Annual Report Download - page 78
Download and view the complete annual report
Please find page 78 of the 2008 Nokia annual report below. You can navigate through the pages in the report by either clicking on the pages listed below, or by using the keyword search tool below to find specific information within the annual report.-
 1
1 -
2
-
3
-
4
-
5
-
6
-
7
-
8
-
9
-
10
-
11
-
12
-
13
-
14
-
15
-
16
-
17
-
18
-
19
-
20
-
21
-
22
-
23
-
24
-
25
-
26
-
27
-
28
-
29
-
30
-
31
-
32
-
33
-
34
-
35
-
36
-
37
-
38
-
39
-
40
-
41
-
42
-
43
-
44
-
45
-
46
-
47
-
48
-
49
-
50
-
51
-
52
-
53
-
54
-
55
-
56
-
57
-
58
-
59
-
60
-
61
-
62
-
63
-
64
-
65
-
66
-
67
-
 68
68 -
 69
69 -
 70
70 -
 71
71 -
 72
72 -
 73
73 -
 74
74 -
 75
75 -
 76
76 -
 77
77 -
 78
78 -
 79
79 -
 80
80 -
 81
81 -
 82
82 -
 83
83 -
 84
84 -
 85
85 -
 86
86 -
 87
87 -
 88
88 -
89
-
90
-
91
-
92
-
93
-
94
-
95
-
96
-
97
-
98
-
99
-
100
-
101
-
102
-
103
-
104
-
105
-
106
-
107
-
108
-
109
-
110
-
111
-
112
-
113
-
114
-
115
-
116
-
117
-
118
-
119
-
120
-
121
-
122
-
123
-
124
-
125
-
126
-
127
-
128
-
129
-
130
-
131
-
132
-
133
-
134
-
135
-
136
-
137
-
138
-
139
-
140
-
141
-
142
-
143
-
144
-
145
-
146
-
147
-
148
-
149
-
150
-
151
-
152
-
153
-
154
-
155
-
156
-
157
-
158
-
159
-
160
-
161
-
162
-
163
-
164
-
165
-
166
-
167
-
168
-
169
-
170
-
171
-
172
-
173
-
174
-
175
-
176
-
177
-
178
-
179
-
180
-
181
-
182
-
183
-
184
-
185
-
186
-
187
-
188
-
189
-
190
-
191
-
192
-
193
-
194
-
195
-
196
-
197
-
198
-
199
-
200
-
201
-
202
-
203
-
204
-
205
-
206
-
207
-
208
-
209
-
210
-
211
-
212
-
213
-
214
-
215
-
216
-
217
-
218
-
219
-
220
-
221
-
222
-
223
-
224
-
225
-
226
-
227
 |
 |

were EUR 109 million. NAVTEQ’s selling and marketing expenses primarily consisted of amortization of
intangible assets recorded as part of Nokia’s acquisition of NAVTEQ totaling EUR 57 million. Selling
and marketing expenses were also driven by investments to grow NAVTEQ’s worldwide sales force
and expand the breadth of its product offerings. Selling and marketing expenses represented 30.2%
of NAVTEQ net sales for this period.
NAVTEQ operating loss was EUR 153 million for the period from July 10, 2008 to December 31, 2008,
with an operating margin of negative 42.4%. The operating loss was primarily the result of the
amortization of intangible assets recorded as part of Nokia’s acquisition of NAVTEQ, which was
partially offset by profits from NAVTEQ’s ongoing business.
Nokia Siemens Networks
According to our estimates, the mobile infrastructure market was flat in euro terms in 2008 compared
to 2007 with the trend varying, depending on region. Slowed growth in developed markets was due
to decreasing investments in mature 2G networks which were not fully offset by the capacity
expansions of 3G networks. The mobile infrastructure market still grew in emerging markets such as
Middle East & Africa, Latin America and China due to the continued subscriber growth, resulting in
traffic and correlating capacity increases as well as new network buildouts. Globally, the volume
growth in the networks infrastructure equipment was significantly offset by the price erosion of the
equipment, largely as a result of maturing technologies and intense price competition. The fixed
infrastructure market continued to be characterized by intense price competition in 2008, both in
terms of the equipment price erosion due to heavy competition, especially from Asian vendors, and
declining tariffs.
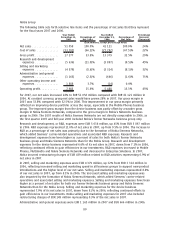
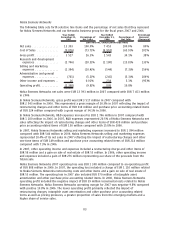
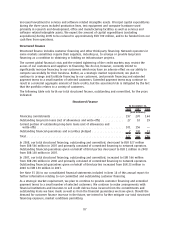
The following table sets forth selective line items and the percentage of net sales that they represent
for Nokia Siemens Networks for the fiscal years 2008 and 2007.
Year Ended
December 31,
2008
Percentage of
Net Sales
Year Ended
December 31,
2007
Percentage of
Net Sales
Percentage
Increase/
(Decrease)
(EUR millions, except percentage data)
Net sales ................. 15309 100.0% 13 393 100.0% 14%
Cost of Sales .............. (10993) (71.8)% (9 876) (73.7)% 11%
Gross profit ............... 4316 28.2% 3 517 26.3% 23%
Research and development
expenses ............... (2500) (16.3)% (2 746) (20.5)% (9.0)%
Selling and marketing
expenses ............... (1421) (9.3)% (1 394) (10.4)% 2%
Administrative and general
expenses ............... (689) (4.5)% (701) (5.2)% (2)%
Other income and expenses . . (7) (0.0)% 16 0.1%
Operating profit............ (301) (2.0)% (1 308) (9.8)% 77%
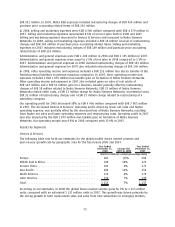
Nokia Siemens Networks’ net sales in 2008 increased 14% to EUR 15 309 million compared with
EUR 13 393 million in 2007. The increased net sales were primarily due to the fact that the results of
Nokia Siemens Networks from January 1, 2007 to March 31, 2007 included our former Networks
business group only and the challenges related to the start of the operations of Nokia Siemens
Networks in 2007. At constant currency, Nokia Siemens Networks’ net sales would have increased by
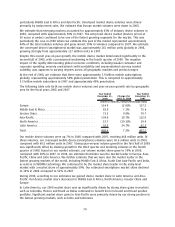
20%. The following table sets forth Nokia Siemens Networks net sales by geographic area for the
fiscal years 2008 and 2007.
77