Nokia 2008 Annual Report Download - page 174
Download and view the complete annual report
Please find page 174 of the 2008 Nokia annual report below. You can navigate through the pages in the report by either clicking on the pages listed below, or by using the keyword search tool below to find specific information within the annual report.-
 1
1 -
2
-
3
-
4
-
5
-
6
-
7
-
8
-
9
-
10
-
11
-
12
-
13
-
14
-
15
-
16
-
17
-
18
-
19
-
20
-
21
-
22
-
23
-
24
-
25
-
26
-
27
-
28
-
29
-
30
-
31
-
32
-
33
-
34
-
35
-
36
-
37
-
38
-
39
-
40
-
41
-
42
-
43
-
44
-
45
-
46
-
47
-
48
-
49
-
50
-
51
-
52
-
53
-
54
-
55
-
56
-
57
-
58
-
59
-
60
-
61
-
62
-
63
-
64
-
65
-
66
-
67
-
68
-
69
-
70
-
71
-
72
-
73
-
74
-
75
-
76
-
77
-
78
-
79
-
80
-
81
-
82
-
83
-
84
-
85
-
86
-
87
-
88
-
89
-
90
-
91
-
92
-
93
-
94
-
95
-
96
-
97
-
98
-
99
-
100
-
101
-
102
-
103
-
104
-
105
-
106
-
107
-
108
-
109
-
110
-
111
-
112
-
113
-
114
-
115
-
116
-
117
-
118
-
119
-
120
-
121
-
122
-
123
-
124
-
125
-
126
-
127
-
128
-
129
-
130
-
131
-
132
-
133
-
134
-
135
-
136
-
137
-
138
-
139
-
140
-
141
-
142
-
143
-
144
-
145
-
146
-
147
-
148
-
149
-
150
-
151
-
152
-
153
-
154
-
155
-
156
-
157
-
158
-
159
-
160
-
161
-
162
-
163
-
 164
164 -
 165
165 -
 166
166 -
 167
167 -
 168
168 -
 169
169 -
 170
170 -
 171
171 -
 172
172 -
 173
173 -
 174
174 -
 175
175 -
 176
176 -
 177
177 -
 178
178 -
 179
179 -
 180
180 -
 181
181 -
 182
182 -
 183
183 -
 184
184 -
185
-
186
-
187
-
188
-
189
-
190
-
191
-
192
-
193
-
194
-
195
-
196
-
197
-
198
-
199
-
200
-
201
-
202
-
203
-
204
-
205
-
206
-
207
-
208
-
209
-
210
-
211
-
212
-
213
-
214
-
215
-
216
-
217
-
218
-
219
-
220
-
221
-
222
-
223
-
224
-
225
-
226
-
227
 |
 |

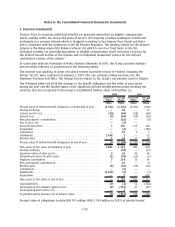
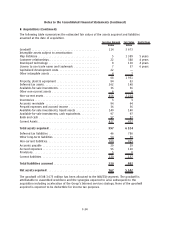
5. Pensions (Continued)
The expected longterm rate of return on plan assets is based on the expected return multiplied with
the respective percentage weight of the marketrelated value of plan assets. The expected return is
defined on a uniform basis, reflecting longterm historical returns, current market conditions and
strategic asset allocation.
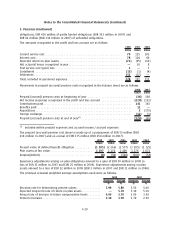
The Groups’s pension plan weighted average asset allocation as a percentage of Plan Assets at
December 31, 2008, and 2007, by asset category are as follows:
Domestic Foreign Domestic Foreign
2008 2007
%%%%
Asset category:
Equity securities ...................................... —1212 11
Debt securities ....................................... —7278 85
Insurance contracts.................................... —803
Real estate .......................................... —111
Shortterm investments ................................ —79—
Total ............................................... — 100 100 100
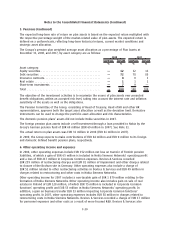
The objective of the investment activities is to maximize the excess of plan assets over projected
benefit obligations, within an accepted risk level, taking into account the interest rate and inflation
sensitivity of the assets as well as the obligations.
The Pension Committee of the Group, consisting of Head of Treasury, Head of HR and other HR
representatives, approves both the target asset allocation as well as the deviation limit. Derivative
instruments can be used to change the portfolio asset allocation and risk characteristics.
The domestic pension plans’ assets did not include Nokia securities in 2007.
The foreign pension plan assets include a self investment through a loan provided to Nokia by the
Group’s German pension fund of EUR 69 million (EUR 69 million in 2007). See Note 31.
The actual return on plan assets was EUR 31 million in 2008 (EUR 61 million in 2007).
In 2009, the Group expects to make contributions of EUR 64 million and EUR 0 million to its foreign
and domestic defined benefit pension plans, respectively.
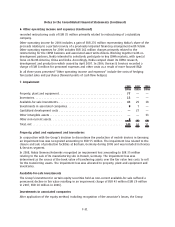
6. Other operating income and expenses
In 2008, other operating expenses include EUR 152 million net loss on transfer of Finnish pension
liabilities, of which a gain of EUR 65 million is included in Nokia Siemens Networks’ operating profit
and a loss of EUR 217 million in Corporate Common expenses. Devices & Services recorded
EUR 259 million of restructuring charges and EUR 81 million of impairment and other charges related
to closure of the Bochum site in Germany. Other operating expenses also include a charge of
EUR 52 million related to other restructuring activities in Devices & Services and EUR 49 million in
charges related to restructuring and other costs in Nokia Siemens Networks.
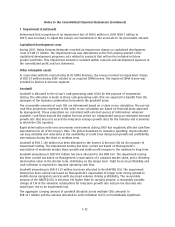
Other operating income for 2007 includes a nontaxable gain of EUR 1 879 million relating to the
formation of Nokia Siemens Networks. Other operating income also includes gain on sale of real
estates in Finland of EUR 128 million, of which EUR 75 million is included in Corporate Common
functions’ operating profit and EUR 53 million in Nokia Siemens Networks’ operating profit. In
addition, a gain on business transfer EUR 53 million impacting Corporate Common functions’
operating profit. In 2007, other operating expenses includes EUR 58 million in charges related to
restructuring costs in Nokia Siemens Networks. Devices & Services recorded a charge of EUR 17 million
for personnel expenses and other costs as a result of more focused R&D. Devices & Services also
F30
Notes to the Consolidated Financial Statements (Continued)