Nokia 2008 Annual Report Download - page 77
Download and view the complete annual report
Please find page 77 of the 2008 Nokia annual report below. You can navigate through the pages in the report by either clicking on the pages listed below, or by using the keyword search tool below to find specific information within the annual report.-
 1
1 -
2
-
3
-
4
-
5
-
6
-
7
-
8
-
9
-
10
-
11
-
12
-
13
-
14
-
15
-
16
-
17
-
18
-
19
-
20
-
21
-
22
-
23
-
24
-
25
-
26
-
27
-
28
-
29
-
30
-
31
-
32
-
33
-
34
-
35
-
36
-
37
-
38
-
39
-
40
-
41
-
42
-
43
-
44
-
45
-
46
-
47
-
48
-
49
-
50
-
51
-
52
-
53
-
54
-
55
-
56
-
57
-
58
-
59
-
60
-
61
-
62
-
63
-
64
-
65
-
66
-
 67
67 -
 68
68 -
 69
69 -
 70
70 -
 71
71 -
 72
72 -
 73
73 -
 74
74 -
 75
75 -
 76
76 -
 77
77 -
 78
78 -
 79
79 -
 80
80 -
 81
81 -
 82
82 -
 83
83 -
 84
84 -
 85
85 -
 86
86 -
 87
87 -
88
-
89
-
90
-
91
-
92
-
93
-
94
-
95
-
96
-
97
-
98
-
99
-
100
-
101
-
102
-
103
-
104
-
105
-
106
-
107
-
108
-
109
-
110
-
111
-
112
-
113
-
114
-
115
-
116
-
117
-
118
-
119
-
120
-
121
-
122
-
123
-
124
-
125
-
126
-
127
-
128
-
129
-
130
-
131
-
132
-
133
-
134
-
135
-
136
-
137
-
138
-
139
-
140
-
141
-
142
-
143
-
144
-
145
-
146
-
147
-
148
-
149
-
150
-
151
-
152
-
153
-
154
-
155
-
156
-
157
-
158
-
159
-
160
-
161
-
162
-
163
-
164
-
165
-
166
-
167
-
168
-
169
-
170
-
171
-
172
-
173
-
174
-
175
-
176
-
177
-
178
-
179
-
180
-
181
-
182
-
183
-
184
-
185
-
186
-
187
-
188
-
189
-
190
-
191
-
192
-
193
-
194
-
195
-
196
-
197
-
198
-
199
-
200
-
201
-
202
-
203
-
204
-
205
-
206
-
207
-
208
-
209
-
210
-
211
-
212
-
213
-
214
-
215
-
216
-
217
-
218
-
219
-
220
-
221
-
222
-
223
-
224
-
225
-
226
-
227
 |
 |

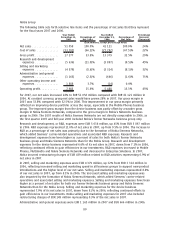
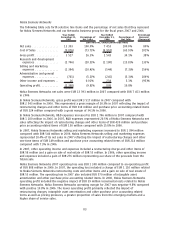
Other operating income and expenses were EUR 520 million in 2008 and included EUR 392 million of
restructuring charges primarily related to the closure of the Bochum site in Germany. In 2007, other
operating income and expenses included EUR 57 million of restructuring charges and a EUR 53 million
gain on business transfer.
In 2008, Devices & Services operating profit decreased 23% to EUR 5 816 million compared with EUR 7
584 million in 2007, with a 16.6% operating margin, down from 20.1% in 2007. The decrease in
operating profit in 2008 was primarily driven by lower net sales and higher operating expenses
compared to 2007.
NAVTEQ
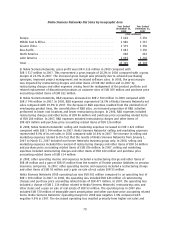
The following table sets forth selective line items and the percentage of net sales that they represent
for NAVTEQ for the period from July 10, 2008 to December 31, 2008.
From July 10 to
December 31,
2008
Percentage of
Net Sales
(EUR millions, except percentage data)
Net sales ............................................... 361 100.0%
Cost of sales ............................................ (43) (11.9)%
Gross profit ............................................. 318 88.1%
Research and development expenses ......................... (332) (92.0)%
Selling and marketing expenses ............................. (109) (30.2)%
Administrative and general expenses ......................... (30) (8.3)%
Other operating income and expenses ........................ — 0.0%
Operating profit.......................................... (153) (42.4)%
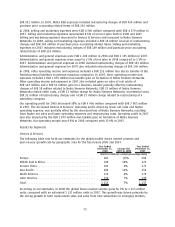
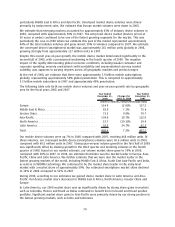
NAVTEQ net sales for the period from July 10, 2008 to December 31, 2008 were EUR 361 million. Net
sales were driven by the licensing of NAVTEQ’s geographic database and related locationbased
content. The following table sets forth NAVTEQ net sales by geographic area for the period from
July 10, 2008 to December 31, 2008.
From July 10 to
December 31,
2008
(EUR millions)
Europe ................................................................. 158
Middle East & Africa ...................................................... 29
China .................................................................. 2
AsiaPacific ............................................................. 10
North America ........................................................... 155
Latin America ........................................................... 7
Total................................................................... 361
For the period from July 10, 2008 to December 31, 2008, NAVTEQ gross profit was EUR 318 million.
Gross profit reflects net sales, partially offset by costs related to the delivery of NAVTEQ’s database
information to its customers.
NAVTEQ R&D expenses for the period from July 10, 2008 to December 31, 2008 were EUR 332 million.
NAVTEQ R&D expenses included amortization of intangible assets recorded as part of Nokia’s
acquisition of NAVTEQ totaling EUR 171 million. R&D expenses were also driven by increased
investment in NAVTEQ’s map database related to geographic expansion and quality improvements.
R&D expenses represented 92.0% of NAVTEQ net sales for this period.
For the period from July 10, 2008 to December 31, 2008, NAVTEQ’s selling and marketing expenses
76