MasterCard 2011 Annual Report Download - page 68
Download and view the complete annual report
Please find page 68 of the 2011 MasterCard annual report below. You can navigate through the pages in the report by either clicking on the pages listed below, or by using the keyword search tool below to find specific information within the annual report.-
 1
1 -
2
-
3
-
4
-
5
-
6
-
7
-
8
-
9
-
10
-
11
-
12
-
13
-
14
-
15
-
16
-
17
-
18
-
19
-
20
-
21
-
22
-
23
-
24
-
25
-
26
-
27
-
28
-
29
-
30
-
31
-
32
-
33
-
34
-
35
-
36
-
37
-
38
-
39
-
40
-
41
-
42
-
43
-
44
-
45
-
46
-
47
-
48
-
49
-
50
-
51
-
52
-
53
-
54
-
55
-
56
-
57
-
 58
58 -
 59
59 -
 60
60 -
 61
61 -
 62
62 -
 63
63 -
 64
64 -
 65
65 -
 66
66 -
 67
67 -
 68
68 -
 69
69 -
 70
70 -
 71
71 -
 72
72 -
 73
73 -
 74
74 -
 75
75 -
 76
76 -
 77
77 -
 78
78 -
79
-
80
-
81
-
82
-
83
-
84
-
85
-
86
-
87
-
88
-
89
-
90
-
91
-
92
-
93
-
94
-
95
-
96
-
97
-
98
-
99
-
100
-
101
-
102
-
103
-
104
-
105
-
106
-
107
-
108
-
109
-
110
-
111
-
112
-
113
-
114
-
115
-
116
-
117
-
118
-
119
-
120
-
121
-
122
-
123
-
124
-
125
-
126
-
127
-
128
-
129
-
130
-
131
-
132
-
133
-
134
-
135
-
136
-
137
-
138
-
139
-
140
-
141
-
142
-
143
-
144
-
145
-
146
-
147
-
148
-
149
-
150
-
151
-
152
-
153
-
154
-
155
-
156
 |
 |

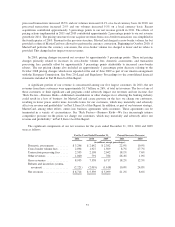
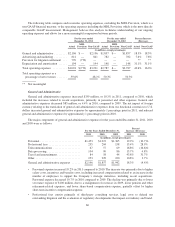
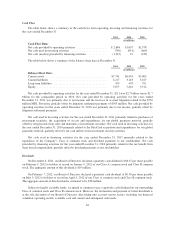
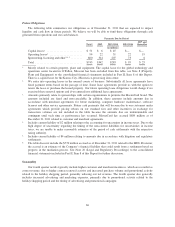
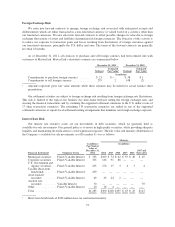
Cash Flow
The table below shows a summary of the cash flows from operating, investing and financing activities for
the years ended December 31:
2011 2010 2009
(in millions)
Cash Flow Data:
Net cash provided by operating activities ...................... $2,684 $1,697 $1,378
Net cash used in investing activities .......................... (748) (641) (664)
Net cash (used in) provided by financing activities .............. (1,215) 19 (185)
The table below shows a summary of the balance sheet data at December 31:
2011 2010 2009
(in millions)
Balance Sheet Data:
Current assets ........................................... $7,741 $6,454 $5,003
Current liabilities ........................................ 4,217 3,143 3,167
Long-term liabilities ...................................... 599 478 791
Equity ................................................. 5,877 5,216 3,512
Net cash provided by operating activities for the year ended December 31, 2011 was $2.7 billion versus $1.7
billion for the comparable period in 2010. Net cash provided by operating activities for the years ended
December 31, 2011 was primarily due to net income and the increase in accrued litigation related to the $770
million MDL Provision, partially offset by litigation settlement payments of $303 million. Net cash provided by
operating activities for the years ended December 31, 2010 was primarily due to net income, partially offset by
litigation settlement payments.
Net cash used in investing activities for the year ended December 31, 2011 primarily related to purchases of
investment securities, the acquisition of Access and expenditures for our global payments network, partially
offset by net proceeds from sales and maturities of investment securities. Net cash used in investing activities for
the year ended December 31, 2010 primarily related to the DataCash acquisition and expenditures for our global
payments network, partially offset by net cash inflows from investment security activities.
Net cash used in financing activities for the year ended December 31, 2011 primarily related to the
repurchase of the Company’s Class A common stock and dividend payments to our stockholders. Net cash
provided by financing activities for the year ended December 31, 2010 primarily related to the tax benefit from
share based compensation, partially offset by dividend payments to our stockholders.
Dividends
On December 6, 2011, our Board of Directors declared a quarterly cash dividend of $0.15 per share payable
on February 9, 2012 to holders of record on January 9, 2012 of our Class A common stock and Class B common
stock. The aggregate amount of this dividend is $19 million.
On February 7, 2012, our Board of Directors declared a quarterly cash dividend of $0.30 per share payable
on May 9, 2012 to holders of record on April 9, 2012 of our Class A common stock and Class B common stock.
The aggregate amount of this dividend is estimated to be $38 million.
Subject to legally available funds, we intend to continue to pay a quarterly cash dividend on our outstanding
Class A common stock and Class B common stock. However, the declaration and payment of future dividends is
at the sole discretion of our Board of Directors after taking into account various factors, including our financial
condition, operating results, available cash and current and anticipated cash needs.
64