MasterCard 2011 Annual Report Download - page 112
Download and view the complete annual report
Please find page 112 of the 2011 MasterCard annual report below. You can navigate through the pages in the report by either clicking on the pages listed below, or by using the keyword search tool below to find specific information within the annual report.-
 1
1 -
2
-
3
-
4
-
5
-
6
-
7
-
8
-
9
-
10
-
11
-
12
-
13
-
14
-
15
-
16
-
17
-
18
-
19
-
20
-
21
-
22
-
23
-
24
-
25
-
26
-
27
-
28
-
29
-
30
-
31
-
32
-
33
-
34
-
35
-
36
-
37
-
38
-
39
-
40
-
41
-
42
-
43
-
44
-
45
-
46
-
47
-
48
-
49
-
50
-
51
-
52
-
53
-
54
-
55
-
56
-
57
-
58
-
59
-
60
-
61
-
62
-
63
-
64
-
65
-
66
-
67
-
68
-
69
-
70
-
71
-
72
-
73
-
74
-
75
-
76
-
77
-
78
-
79
-
80
-
81
-
82
-
83
-
84
-
85
-
86
-
87
-
88
-
89
-
90
-
91
-
92
-
93
-
94
-
95
-
96
-
97
-
98
-
99
-
100
-
101
-
 102
102 -
 103
103 -
 104
104 -
 105
105 -
 106
106 -
 107
107 -
 108
108 -
 109
109 -
 110
110 -
 111
111 -
 112
112 -
 113
113 -
 114
114 -
 115
115 -
 116
116 -
 117
117 -
 118
118 -
 119
119 -
 120
120 -
 121
121 -
 122
122 -
123
-
124
-
125
-
126
-
127
-
128
-
129
-
130
-
131
-
132
-
133
-
134
-
135
-
136
-
137
-
138
-
139
-
140
-
141
-
142
-
143
-
144
-
145
-
146
-
147
-
148
-
149
-
150
-
151
-
152
-
153
-
154
-
155
-
156
 |
 |

MASTERCARD INCORPORATED
NOTES TO CONSOLIDATED FINANCIAL STATEMENTS—(Continued)
The Company’s discount rate assumptions are based on a yield curve derived from high quality corporate
bonds, which is matched to the expected cash flows to each of the respective Plans.
For the Qualified Plan, the Company utilized an actuarial practice referred to as a building block method to
determine the assumption for the expected weighted average return on plan assets. This method includes the
following components: (1) compiling historical return data for both the equity and fixed income markets over the
past ten-, twenty- and thirty-year periods; (2) weighting the assets within our portfolio at December 31, 2011 by
class; and (3) identifying expected rate of return on assets utilizing both current and historical market experience.
Plan assets are managed with a long-term perspective intended to ensure that there is an adequate level of
assets to support benefit payments to participants over the life of the Qualified Plan. In 2011, the Company
conducted an asset-liability study to assess the preferred target asset allocation. As a result of the study, the
Company increased the asset allocation to fixed income from 30% to 60% and decreased the asset allocation to
equities from 70% to 40%. Plan assets are managed within asset allocation ranges, towards targets of 60% fixed
income, 24% large/medium cap U.S. equity, 8% small cap U.S. equity, and 8% non-U.S. equity. The Company
intends to increase the allocation to fixed income, subject to certain improvements in Plan funded status. Plan
assets are managed by external investment managers. Investment manager performance is measured against
benchmarks for each asset class and peer group on quarterly, one-, three-, and five-year periods. An external
advisor assists management with investment manager selections and performance evaluations. The balance in
cash and cash equivalents is available to pay expected benefit payments and expenses. Considering the change in
plan allocation targets, the Company reduced the 2012 expected return on plan assets assumption from 8% to 6%.
The Valuation Hierarchy of the Qualified Plan’s assets is determined using a consistent application of the
categorization measurements for the Company’s financial instruments. See Note 1 (Summary of Significant
Accounting Policies).
Mutual funds (including small cap U.S. equity securities and non-U.S. equity securities) are public
investment vehicles valued at quoted market prices, which represent the net asset value of the shares held by the
Qualified Plan and are therefore included in Level 1 of the Valuation Hierarchy. Commingled funds (including
large/medium cap U.S. equity securities and fixed income securities) are valued at unit values provided by
investment managers, which are based on the fair value of the underlying investments utilizing public
information, independent external valuation from third-party services or third-party advisors, and are therefore
included in Level 2 of the Valuation Hierarchy.
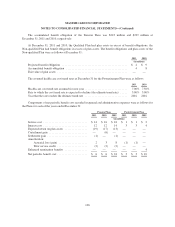
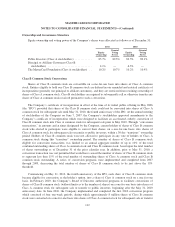
The following table sets forth by level, within the Valuation Hierarchy, the Qualified Plan’s assets at fair
value as of December 31, 2011 and 2010:
December 31, 2011
Quoted Prices
in Active
Markets
(Level 1)
Significant
Other
Observable
Inputs
(Level 2)
Significant
Unobservable
Inputs
(Level 3)
Fair
Value
(in millions)
Mutual funds:
Money market ........................ $ 2 $— $— $ 2
Domestic small cap equity ............... 19 — — 19
International equity .................... 16 — — 16
Common and collective funds:
Domestic large cap equity ............... — 59 — 59
Domestic fixed income ................. — 147 — 147
Total .................................... $ 37 $206 $— $243
108