MasterCard 2011 Annual Report Download - page 61
Download and view the complete annual report
Please find page 61 of the 2011 MasterCard annual report below. You can navigate through the pages in the report by either clicking on the pages listed below, or by using the keyword search tool below to find specific information within the annual report.-
 1
1 -
2
-
3
-
4
-
5
-
6
-
7
-
8
-
9
-
10
-
11
-
12
-
13
-
14
-
15
-
16
-
17
-
18
-
19
-
20
-
21
-
22
-
23
-
24
-
25
-
26
-
27
-
28
-
29
-
30
-
31
-
32
-
33
-
34
-
35
-
36
-
37
-
38
-
39
-
40
-
41
-
42
-
43
-
44
-
45
-
46
-
47
-
48
-
49
-
50
-
 51
51 -
 52
52 -
 53
53 -
 54
54 -
 55
55 -
 56
56 -
 57
57 -
 58
58 -
 59
59 -
 60
60 -
 61
61 -
 62
62 -
 63
63 -
 64
64 -
 65
65 -
 66
66 -
 67
67 -
 68
68 -
 69
69 -
 70
70 -
 71
71 -
72
-
73
-
74
-
75
-
76
-
77
-
78
-
79
-
80
-
81
-
82
-
83
-
84
-
85
-
86
-
87
-
88
-
89
-
90
-
91
-
92
-
93
-
94
-
95
-
96
-
97
-
98
-
99
-
100
-
101
-
102
-
103
-
104
-
105
-
106
-
107
-
108
-
109
-
110
-
111
-
112
-
113
-
114
-
115
-
116
-
117
-
118
-
119
-
120
-
121
-
122
-
123
-
124
-
125
-
126
-
127
-
128
-
129
-
130
-
131
-
132
-
133
-
134
-
135
-
136
-
137
-
138
-
139
-
140
-
141
-
142
-
143
-
144
-
145
-
146
-
147
-
148
-
149
-
150
-
151
-
152
-
153
-
154
-
155
-
156
 |
 |

processed transactions increased 18.3% and our volumes increased 16.1% on a local currency basis. In 2010, our
processed transactions increased 2.9% and our volumes increased 9.1% on a local currency basis. Recent
acquisitions contributed approximately 3 percentage points to our net revenue growth in 2011. The effects of
pricing actions implemented in 2011 and 2010 contributed approximately 2 percentage points to our net revenue
growth for 2011. The pricing structure for our acquirer revenues from cross-border transactions was simplified in
the fourth quarter of 2010. Pursuant to the previous structure, MasterCard charged a cross-border volume fee but
provided a rebate if MasterCard was allowed to perform the currency conversion. Beginning in October 2010, if
MasterCard performs the currency conversion, the cross-border volume fee charged is lower and no rebate is
provided. This change had no impact on net revenues.
In 2010, pricing changes increased net revenues by approximately 5 percentage points. These net pricing
changes primarily related to increases in cross-border volume fees, domestic assessments, and transaction
processing fees, partially offset by approximately 3 percentage points attributable to increased cross-border
rebates. The net pricing change also included an approximately 1 percentage point decrease relating to the
October 2008 pricing changes which were repealed at the end of June 2009 as part of our interim arrangement
with the European Commission. See Note 20 (Legal and Regulatory Proceedings) to the consolidated financial
statements included in Part II, Item 8 of this Report.
A significant portion of our revenue is concentrated among our five largest customers. In 2011, the net
revenues from these customers were approximately $1.7 billion, or 26%, of total net revenues. The loss of any of
these customers or their significant card programs could adversely impact our revenues and net income. See
“Risk Factors—Business Risks—Additional consolidation or other changes in or affecting the banking industry
could result in a loss of business for MasterCard and create pressure on the fees we charge our customers,
resulting in lower prices and/or more favorable terms for our customers, which may materially and adversely
affect our revenue and profitability” in Part I, Item 1A of this Report. In addition, as part of our business strategy,
MasterCard, among other efforts, enters into business agreements with customers. These agreements can be
terminated in a variety of circumstances. See “Risk Factors—Business Risks—We face increasingly intense
competitive pressure on the prices we charge our customers, which may materially and adversely affect our
revenue and profitability” in Part I, Item 1A of this Report.
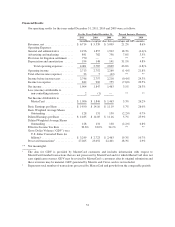
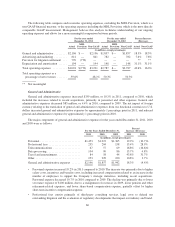
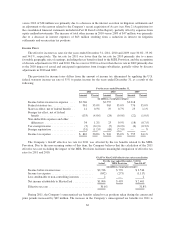
The significant components of our net revenues for the years ended December 31, 2011, 2010 and 2009
were as follows:
For the Years Ended December 31, Percent Increase (Decrease)
2011 2010 2009 2011 2010
(in millions, except percentages)
Domestic assessments ......... $3,246 $ 2,642 $ 2,382 22.9% 10.9%
Cross-border volume fees ....... 2,094 1,927 1,509 8.7% 27.7%
Transaction processing fees ..... 2,595 2,198 2,042 18.1% 7.6%
Other revenues ............... 1,000 791 784 26.4% 1.0%
Gross revenues ............... 8,935 7,558 6,717 18.2% 12.5%
Rebates and incentives (contra-
revenues) .................. (2,221) (2,019) (1,618) 10.0% 24.8%
Net revenues ................. $6,714 $ 5,539 $ 5,099 21.2% 8.6%
57