MasterCard 2011 Annual Report Download - page 58
Download and view the complete annual report
Please find page 58 of the 2011 MasterCard annual report below. You can navigate through the pages in the report by either clicking on the pages listed below, or by using the keyword search tool below to find specific information within the annual report.-
 1
1 -
2
-
3
-
4
-
5
-
6
-
7
-
8
-
9
-
10
-
11
-
12
-
13
-
14
-
15
-
16
-
17
-
18
-
19
-
20
-
21
-
22
-
23
-
24
-
25
-
26
-
27
-
28
-
29
-
30
-
31
-
32
-
33
-
34
-
35
-
36
-
37
-
38
-
39
-
40
-
41
-
42
-
43
-
44
-
45
-
46
-
47
-
 48
48 -
 49
49 -
 50
50 -
 51
51 -
 52
52 -
 53
53 -
 54
54 -
 55
55 -
 56
56 -
 57
57 -
 58
58 -
 59
59 -
 60
60 -
 61
61 -
 62
62 -
 63
63 -
 64
64 -
 65
65 -
 66
66 -
 67
67 -
 68
68 -
69
-
70
-
71
-
72
-
73
-
74
-
75
-
76
-
77
-
78
-
79
-
80
-
81
-
82
-
83
-
84
-
85
-
86
-
87
-
88
-
89
-
90
-
91
-
92
-
93
-
94
-
95
-
96
-
97
-
98
-
99
-
100
-
101
-
102
-
103
-
104
-
105
-
106
-
107
-
108
-
109
-
110
-
111
-
112
-
113
-
114
-
115
-
116
-
117
-
118
-
119
-
120
-
121
-
122
-
123
-
124
-
125
-
126
-
127
-
128
-
129
-
130
-
131
-
132
-
133
-
134
-
135
-
136
-
137
-
138
-
139
-
140
-
141
-
142
-
143
-
144
-
145
-
146
-
147
-
148
-
149
-
150
-
151
-
152
-
153
-
154
-
155
-
156
 |
 |
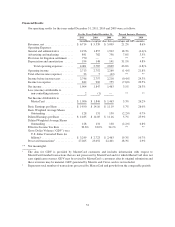
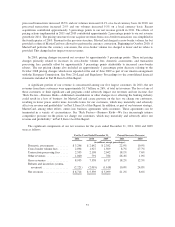
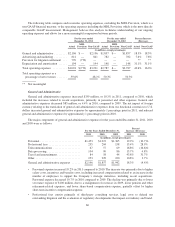
Impact of Foreign Currency Rates
Our overall operating results are impacted by changes in foreign currency exchange rates, especially the
strengthening or weakening of the U.S. dollar versus the euro and Brazilian real. The functional currency of
MasterCard Europe, our principal European operating subsidiary, is the euro, and the functional currency of our
Brazilian subsidiary is the Brazilian real. Accordingly, the strengthening or weakening of the U.S. dollar versus
the euro and Brazilian real impacts the translation of our European and Brazilian subsidiaries’ operating results
into the U.S. dollar. For 2011 as compared to 2010, the U.S. dollar weakened against both the euro and the
Brazilian real. Accordingly, the net foreign currency impact of changes in the U.S. dollar average exchange rates
against the euro and Brazilian real increased net revenues and expenses by approximately 2 percentage points in
2011. For 2010 as compared to 2009, the U.S. dollar average exchange rates strengthened against the euro and
weakened against the Brazilian real, which decreased revenues and expenses by approximately 1 percentage
point.
In addition, changes in foreign currency exchange rates directly impact the calculation of gross dollar
volume (“GDV”) and gross euro volume (“GEV”), which are used in the calculation of our domestic
assessments, cross-border volume fees and volume related rebates and incentives. In most non-European regions,
GDV is calculated based on local currency spending volume converted to U.S. dollars using average exchange
rates for the period. In Europe, GEV is calculated based on local currency spending volume converted to euros
using average exchange rates for the period. As a result, our domestic assessments, cross-border volume fees and
volume related rebates and incentives are impacted by the strengthening or weakening of the U.S. dollar versus
most non-European local currencies and the strengthening or weakening of the euro versus European local
currencies. The strengthening or weakening of the U.S. dollar is evident when GDV growth on a U.S. dollar
converted basis is compared to GDV growth on a local currency basis. In 2011, GDV on a U.S. converted basis
increased 19.3%, versus GDV growth on a local currency basis of 16.1%. In 2010, GDV on a U.S. converted
basis increased 10.7%, versus GDV growth on a local currency basis of 9.1%. The Company attempts to manage
these foreign currency exposures through its foreign exchange risk management activities, which are discussed
further in Note 22 (Foreign Exchange Risk Management) to the consolidated financial statements included in
Part II, Item 8 of this Report.
Revenues
Revenue Descriptions
MasterCard’s business model involves four participants in addition to us: cardholders, merchants, issuers
(the cardholders’ financial institutions) and acquirers (the merchants’ financial institutions). Our gross revenues
are typically based on the volume of activity on cards and other devices that carry our brands, the number of
transactions we process for our customers or the nature of other payment-related services we provide to our
customers. Our revenues are based upon transactional information accumulated by our systems or reported by
our customers. Our primary revenue billing currencies are the U.S. dollar, euro and Brazilian real.
We process transactions denominated in more than 150 currencies through our global system, providing
cardholders with the ability to utilize, and merchants to accept, MasterCard cards across multiple country
borders. We process most of the cross-border transactions using MasterCard, Maestro and Cirrus-branded cards
and process the majority of MasterCard-branded domestic transactions in the United States, United Kingdom,
Canada, Brazil and a select number of other smaller countries.
Our pricing is complex and is dependent on the nature of the volumes, types of transactions and other
products and services we offer to our customers. A combination of the following factors determines the pricing:
• Domestic or cross-border
• Signature-based (credit and debit) or PIN-based (debit, including automated teller machine (“ATM”)
cash withdrawals and retail purchases)
54