MasterCard 2011 Annual Report Download - page 54
Download and view the complete annual report
Please find page 54 of the 2011 MasterCard annual report below. You can navigate through the pages in the report by either clicking on the pages listed below, or by using the keyword search tool below to find specific information within the annual report.-
 1
1 -
2
-
3
-
4
-
5
-
6
-
7
-
8
-
9
-
10
-
11
-
12
-
13
-
14
-
15
-
16
-
17
-
18
-
19
-
20
-
21
-
22
-
23
-
24
-
25
-
26
-
27
-
28
-
29
-
30
-
31
-
32
-
33
-
34
-
35
-
36
-
37
-
38
-
39
-
40
-
41
-
42
-
43
-
 44
44 -
 45
45 -
 46
46 -
 47
47 -
 48
48 -
 49
49 -
 50
50 -
 51
51 -
 52
52 -
 53
53 -
 54
54 -
 55
55 -
 56
56 -
 57
57 -
 58
58 -
 59
59 -
 60
60 -
 61
61 -
 62
62 -
 63
63 -
 64
64 -
65
-
66
-
67
-
68
-
69
-
70
-
71
-
72
-
73
-
74
-
75
-
76
-
77
-
78
-
79
-
80
-
81
-
82
-
83
-
84
-
85
-
86
-
87
-
88
-
89
-
90
-
91
-
92
-
93
-
94
-
95
-
96
-
97
-
98
-
99
-
100
-
101
-
102
-
103
-
104
-
105
-
106
-
107
-
108
-
109
-
110
-
111
-
112
-
113
-
114
-
115
-
116
-
117
-
118
-
119
-
120
-
121
-
122
-
123
-
124
-
125
-
126
-
127
-
128
-
129
-
130
-
131
-
132
-
133
-
134
-
135
-
136
-
137
-
138
-
139
-
140
-
141
-
142
-
143
-
144
-
145
-
146
-
147
-
148
-
149
-
150
-
151
-
152
-
153
-
154
-
155
-
156
 |
 |
our customers for use in their payment programs and solutions. We process payment transactions over the
MasterCard Worldwide Network and provide support services to our customers and other partners. As part of
managing our brands, we establish and enforce a common set of standards for adherence by our customers for the
efficient and secure use of our payments network.
We generate revenues from the fees that we charge our customers for providing transaction processing and
other payment-related services and by assessing our customers based primarily on the dollar volume of activity
on the cards and other devices that carry our brands. As cardholder and merchant relationships are managed
principally by our customers, we do not issue cards, extend credit to cardholders, determine the interest rates (if
applicable) or other fees charged to cardholders by issuers, or establish the merchant discount charged by
acquirers in connection with the acceptance of cards and other devices that carry our brands.
We analyze our ability to grow based on three drivers:
• we track trends in personal consumption expenditures;
• we focus on the trend within the global payments industry from paper-based forms of payment, such as
cash and checks, toward electronic forms of payment ( such as payment card transactions); and
• we seek to grow our share in electronic payments, including with innovative solutions and new
technology.
We support our focus on these drivers by continuing to:
• grow our core businesses globally, including credit, debit, prepaid, commercial and processing payment
transactions over the MasterCard Worldwide Network,
• diversify our business by seeking new areas of growth in markets around the world, expanding points of
acceptance for our brands throughout the world, seeking to maintain unsurpassed acceptance, and
working with new partners such as merchants, government agencies and telecommunications
companies, and
• build new businesses through technology and continued strategic efforts and alliances with respect to
innovative payment methods, such as electronic commerce (e-Commerce) and mobile capabilities.
See “—Business Environment” for a discussion of considerations related to our long-term strategic
objectives.
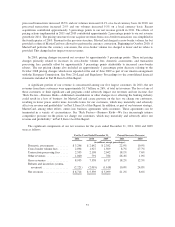
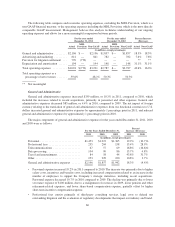
We recorded net income of $1.9 billion, or $14.85 per diluted share, in 2011 versus net income of $1.8
billion, or $14.05 per diluted share, in 2010, and net income of $1.5 billion, or $11.16 per diluted share, in 2009.
In addition, we generated cash flows from operations of $2.7 billion for the year ended December 31, 2011,
compared to $1.7 billion and $1.4 billion for the years ended December 31, 2010 and 2009, respectively. Our
2011 financial results were significantly impacted by the MDL Provision of $770 million (see “—Income Taxes”
for a table which provides a reconciliation showing the $495 million after-tax impact to the net income
attributable to MasterCard).
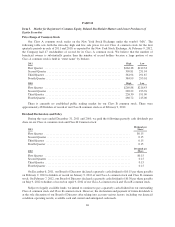
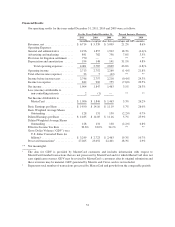
Our net revenues increased 21.2% in 2011 primarily due to the increased dollar volume of activity on cards
carrying our brands and increased transactions. Recent acquisitions also contributed approximately 3 percentage
points to revenue growth in 2011. The net impact of foreign currency relating to the translation of revenues from
our functional currencies to U.S. dollars had a favorable impact on net revenues of approximately 2 percentage
points in 2011. Our net revenues increased 8.6% in 2010, primarily due to the increased dollar volume of activity
on cards carrying our brands, pricing changes and increased transactions. The net impact of foreign currency
relating to the translation of revenues from our functional currencies to U.S. dollars reduced net revenue growth
by approximately 1 percentage point in 2010.
50