MasterCard 2011 Annual Report Download - page 63
Download and view the complete annual report
Please find page 63 of the 2011 MasterCard annual report below. You can navigate through the pages in the report by either clicking on the pages listed below, or by using the keyword search tool below to find specific information within the annual report.-
 1
1 -
2
-
3
-
4
-
5
-
6
-
7
-
8
-
9
-
10
-
11
-
12
-
13
-
14
-
15
-
16
-
17
-
18
-
19
-
20
-
21
-
22
-
23
-
24
-
25
-
26
-
27
-
28
-
29
-
30
-
31
-
32
-
33
-
34
-
35
-
36
-
37
-
38
-
39
-
40
-
41
-
42
-
43
-
44
-
45
-
46
-
47
-
48
-
49
-
50
-
51
-
52
-
 53
53 -
 54
54 -
 55
55 -
 56
56 -
 57
57 -
 58
58 -
 59
59 -
 60
60 -
 61
61 -
 62
62 -
 63
63 -
 64
64 -
 65
65 -
 66
66 -
 67
67 -
 68
68 -
 69
69 -
 70
70 -
 71
71 -
 72
72 -
 73
73 -
74
-
75
-
76
-
77
-
78
-
79
-
80
-
81
-
82
-
83
-
84
-
85
-
86
-
87
-
88
-
89
-
90
-
91
-
92
-
93
-
94
-
95
-
96
-
97
-
98
-
99
-
100
-
101
-
102
-
103
-
104
-
105
-
106
-
107
-
108
-
109
-
110
-
111
-
112
-
113
-
114
-
115
-
116
-
117
-
118
-
119
-
120
-
121
-
122
-
123
-
124
-
125
-
126
-
127
-
128
-
129
-
130
-
131
-
132
-
133
-
134
-
135
-
136
-
137
-
138
-
139
-
140
-
141
-
142
-
143
-
144
-
145
-
146
-
147
-
148
-
149
-
150
-
151
-
152
-
153
-
154
-
155
-
156
 |
 |
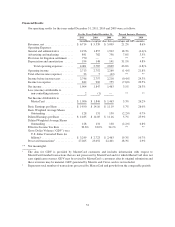
Other revenues—Other revenues increased 26.4% and 1.0% during 2011 and 2010, respectively, primarily
due to the following:
• Revenues from recent acquisitions contributed approximately 13 percentage points to the increase in
2011 without comparable revenues in 2010.
• Increased consulting fees, fraud service fees and other payment-related services in 2011.
• Pricing changes increased other revenues by approximately 3 percentage points in 2011 and had a
minimal impact on 2010.
• The net impact of foreign currency relating to the translation of other revenues from our functional
currencies to U.S. dollars favorably impacted other revenue growth by approximately 2 percentage
points in 2011, and unfavorably impacted revenue growth by approximately 1 percentage point in 2010.
Rebates and incentives—Rebates and incentives increased 10.0% and 24.8% during 2011 and 2010,
respectively. Rebates and incentives as a percentage of gross revenues were 24.9%, 26.7% and 24.1% in 2011,
2010 and 2009, respectively. The amount of rebates and incentives increased primarily due to the following:
• In 2011 and 2010, higher rebates and incentives were driven by increased performance as well as certain
new and renewed agreements. The Company intends to continue to enter into and maintain business
agreements that provide rebates and incentives to certain customers and merchants.
• Pricing changes reduced rebates and incentives growth by approximately 11 percentage points in 2011,
primarily due to the pricing structure change implemented in October 2010, as discussed above under
“—Cross-border volume fees.” In 2010, an increase in cross-border rebates, referred to below,
contributed approximately 10 percentage points to the increase in rebates and incentives, partially offset
by the effects of the pricing structure change in October 2010. Cross-border pricing actions in October
2009 as discussed above under “—Cross-border volume fees”, included an increase to cross-border
rebates to encourage certain behaviors of our customers.
• The net impact of foreign currency relating to the translation of rebates and incentives from our
functional currencies to U.S. dollars increased rebates and incentives by approximately 1 percentage
point in 2011, and had a minimal impact on rebates and incentives in 2010.
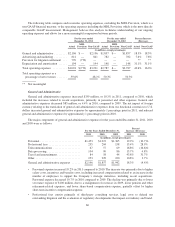
Operating Expenses
Our operating expenses are comprised of general and administrative, advertising and marketing,
depreciation and amortization expenses, and in 2011, the MDL Provision. Operating expenses increased $1.2
billion, or 43.6% in 2011, compared to 2010, primarily due to the $770 million MDL Provision and higher
general and administrative expenses, including expenses related to recent acquisitions. Excluding the impact of
the MDL Provision, operating expenses increased $445 million, or 16.0% in 2011 compared to 2010. The recent
acquisitions contributed approximately 6 percentage points to the increase in operating expenses in 2011. In
2010, operating expenses decreased $52 million, or 1.8% compared to 2009, primarily due to lower general and
administrative expenses, partially offset by increased advertising and marketing expenses.
59