MasterCard 2011 Annual Report Download - page 57
Download and view the complete annual report
Please find page 57 of the 2011 MasterCard annual report below. You can navigate through the pages in the report by either clicking on the pages listed below, or by using the keyword search tool below to find specific information within the annual report.-
 1
1 -
2
-
3
-
4
-
5
-
6
-
7
-
8
-
9
-
10
-
11
-
12
-
13
-
14
-
15
-
16
-
17
-
18
-
19
-
20
-
21
-
22
-
23
-
24
-
25
-
26
-
27
-
28
-
29
-
30
-
31
-
32
-
33
-
34
-
35
-
36
-
37
-
38
-
39
-
40
-
41
-
42
-
43
-
44
-
45
-
46
-
 47
47 -
 48
48 -
 49
49 -
 50
50 -
 51
51 -
 52
52 -
 53
53 -
 54
54 -
 55
55 -
 56
56 -
 57
57 -
 58
58 -
 59
59 -
 60
60 -
 61
61 -
 62
62 -
 63
63 -
 64
64 -
 65
65 -
 66
66 -
 67
67 -
68
-
69
-
70
-
71
-
72
-
73
-
74
-
75
-
76
-
77
-
78
-
79
-
80
-
81
-
82
-
83
-
84
-
85
-
86
-
87
-
88
-
89
-
90
-
91
-
92
-
93
-
94
-
95
-
96
-
97
-
98
-
99
-
100
-
101
-
102
-
103
-
104
-
105
-
106
-
107
-
108
-
109
-
110
-
111
-
112
-
113
-
114
-
115
-
116
-
117
-
118
-
119
-
120
-
121
-
122
-
123
-
124
-
125
-
126
-
127
-
128
-
129
-
130
-
131
-
132
-
133
-
134
-
135
-
136
-
137
-
138
-
139
-
140
-
141
-
142
-
143
-
144
-
145
-
146
-
147
-
148
-
149
-
150
-
151
-
152
-
153
-
154
-
155
-
156
 |
 |

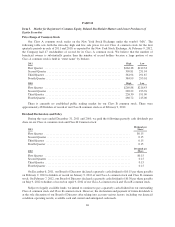
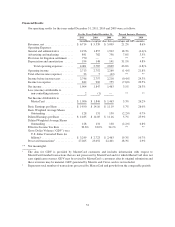
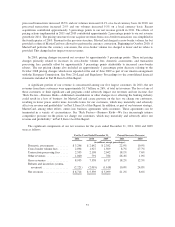
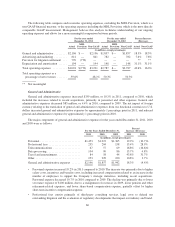
Financial Results
Our operating results for the years ended December 31, 2011, 2010 and 2009 were as follows:
For the Years Ended December 31, Percent Increase (Decrease)
2011 2010 2009 2011 2010
(in millions, except per share data, percentages and GDV amounts)
Revenues, net .................... $ 6,714 $ 5,539 $ 5,099 21.2% 8.6%
Operating Expenses:
General and administrative ......... 2,196 1,857 1,942 18.3% (4.4)%
Advertising and marketing ......... 841 782 756 7.6% 3.5%
Provision for litigation settlement .... 770 — — ** **
Depreciation and amortization ...... 194 148 141 31.1% 4.8%
Total operating expenses ....... 4,001 2,787 2,839 43.6% (1.8)%
Operating income ................ 2,713 2,752 2,260 (1.4)% 21.8%
Total other income (expense) ....... 33 5 (42) ** **
Income before income taxes ........ 2,746 2,757 2,218 (0.4)% 24.3%
Income tax expense ............... 842 910 755 (7.6)% 20.5%
Net income ...................... 1,904 1,847 1,463 3.1% 26.3%
Loss (income) attributable to
non-controlling interests ......... 2 (1) — ** **
Net Income Attributable to
MasterCard ................... $ 1,906 $ 1,846 $ 1,463 3.3% 26.2%
Basic Earnings per Share ........... $ 14.90 $ 14.10 $ 11.19 5.7% 26.0%
Basic Weighted Average Shares
Outstanding ................... 128 131 130 (2.2)% 0.7%
Diluted Earnings per Share ......... $ 14.85 $ 14.05 $ 11.16 5.7% 25.9%
Diluted Weighted Average Shares
Outstanding ................... 128 131 130 (2.2)% 0.8%
Effective Income Tax Rate ......... 30.6% 33.0% 34.1% ** **
Gross Dollar Volume (“GDV”) on a
U.S. dollar Converted Basis (in
billions)1...................... $ 3,249 $ 2,723 $ 2,463 19.3% 10.7%
Processed transactions2............ 27,265 23,052 22,401 18.3% 2.9%
** Not meaningful.
1The data for GDV is provided by MasterCard customers and includes information with respect to
MasterCard-branded transactions that are not processed by MasterCard and for which MasterCard does not
earn significant revenues. GDV may be revised by MasterCard’s customers after its original submission and
these revisions may be material. GDV generated by Maestro and Cirrus cards is not included.
2Represents total number of transactions processed by MasterCard and growth from the comparable periods.
53