MasterCard 2011 Annual Report Download - page 104
Download and view the complete annual report
Please find page 104 of the 2011 MasterCard annual report below. You can navigate through the pages in the report by either clicking on the pages listed below, or by using the keyword search tool below to find specific information within the annual report.-
 1
1 -
2
-
3
-
4
-
5
-
6
-
7
-
8
-
9
-
10
-
11
-
12
-
13
-
14
-
15
-
16
-
17
-
18
-
19
-
20
-
21
-
22
-
23
-
24
-
25
-
26
-
27
-
28
-
29
-
30
-
31
-
32
-
33
-
34
-
35
-
36
-
37
-
38
-
39
-
40
-
41
-
42
-
43
-
44
-
45
-
46
-
47
-
48
-
49
-
50
-
51
-
52
-
53
-
54
-
55
-
56
-
57
-
58
-
59
-
60
-
61
-
62
-
63
-
64
-
65
-
66
-
67
-
68
-
69
-
70
-
71
-
72
-
73
-
74
-
75
-
76
-
77
-
78
-
79
-
80
-
81
-
82
-
83
-
84
-
85
-
86
-
87
-
88
-
89
-
90
-
91
-
92
-
93
-
 94
94 -
 95
95 -
 96
96 -
 97
97 -
 98
98 -
 99
99 -
 100
100 -
 101
101 -
 102
102 -
 103
103 -
 104
104 -
 105
105 -
 106
106 -
 107
107 -
 108
108 -
 109
109 -
 110
110 -
 111
111 -
 112
112 -
 113
113 -
 114
114 -
115
-
116
-
117
-
118
-
119
-
120
-
121
-
122
-
123
-
124
-
125
-
126
-
127
-
128
-
129
-
130
-
131
-
132
-
133
-
134
-
135
-
136
-
137
-
138
-
139
-
140
-
141
-
142
-
143
-
144
-
145
-
146
-
147
-
148
-
149
-
150
-
151
-
152
-
153
-
154
-
155
-
156
 |
 |

MASTERCARD INCORPORATED
NOTES TO CONSOLIDATED FINANCIAL STATEMENTS—(Continued)
All the securities due after ten years are ARS. Taxable short-term bond funds have been included in the
table above in the no contractual maturity category, as these investments do not have a stated maturity date;
however, the short-term bond funds have daily liquidity.
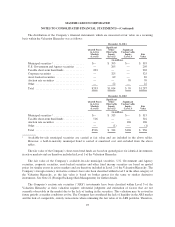
The table below summarizes the maturity ranges of the ARS portfolio, based on relative par value, as of
December 31, 2011.
Par
Amount
%of
Total
(in millions)
Due within 10 years ................................................... $ 4 5%
Due year 11 through year 20 ............................................ 7 9%
Due year 21 through year 30 ............................................ 67 86%
Total ............................................................... $78 100%
Investment Income:
Components of net investment income were as follows:
2011 2010 2009
(in millions)
Interest income .............................................. $ 44 $ 48 $ 56
Investment securities available-for-sale:
Gross realized gains ...................................... 10 9 2
Gross realized losses ...................................... (2) — —
Total investment income, net ................................... $ 52 $ 57 $ 58
Interest income primarily consists of interest income generated from cash, cash equivalents, investment
securities available-for-sale and investment securities held-to-maturity.
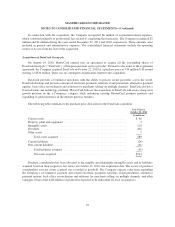
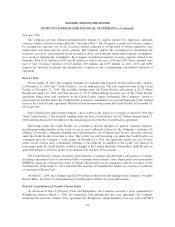
Note 7. Prepaid Expenses and Other Assets
Prepaid expenses and other current assets consisted of the following at December 31:
2011 2010
(in millions)
Customer and merchant incentives ......................................... $190 $215
Prepaid income taxes .................................................... 35 50
Income taxes receivable ................................................. 35 —
Other ................................................................ 144 135
Total prepaid expenses and other current assets ............................... $404 $400
100