MasterCard 2011 Annual Report Download - page 22
Download and view the complete annual report
Please find page 22 of the 2011 MasterCard annual report below. You can navigate through the pages in the report by either clicking on the pages listed below, or by using the keyword search tool below to find specific information within the annual report.-
 1
1 -
2
-
3
-
4
-
5
-
6
-
7
-
8
-
9
-
10
-
11
-
 12
12 -
 13
13 -
 14
14 -
 15
15 -
 16
16 -
 17
17 -
 18
18 -
 19
19 -
 20
20 -
 21
21 -
 22
22 -
 23
23 -
 24
24 -
 25
25 -
 26
26 -
 27
27 -
 28
28 -
 29
29 -
 30
30 -
 31
31 -
 32
32 -
33
-
34
-
35
-
36
-
37
-
38
-
39
-
40
-
41
-
42
-
43
-
44
-
45
-
46
-
47
-
48
-
49
-
50
-
51
-
52
-
53
-
54
-
55
-
56
-
57
-
58
-
59
-
60
-
61
-
62
-
63
-
64
-
65
-
66
-
67
-
68
-
69
-
70
-
71
-
72
-
73
-
74
-
75
-
76
-
77
-
78
-
79
-
80
-
81
-
82
-
83
-
84
-
85
-
86
-
87
-
88
-
89
-
90
-
91
-
92
-
93
-
94
-
95
-
96
-
97
-
98
-
99
-
100
-
101
-
102
-
103
-
104
-
105
-
106
-
107
-
108
-
109
-
110
-
111
-
112
-
113
-
114
-
115
-
116
-
117
-
118
-
119
-
120
-
121
-
122
-
123
-
124
-
125
-
126
-
127
-
128
-
129
-
130
-
131
-
132
-
133
-
134
-
135
-
136
-
137
-
138
-
139
-
140
-
141
-
142
-
143
-
144
-
145
-
146
-
147
-
148
-
149
-
150
-
151
-
152
-
153
-
154
-
155
-
156
 |
 |

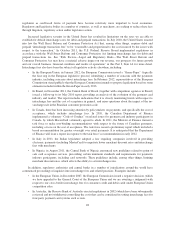
GDV and Processed Transactions
The tables below provide information regarding two key drivers of our revenue: (1) GDV, which forms the
basis of volume-based revenues, and (2) processed transactions.
GDV. The GDV table below provides information regarding the GDV for all MasterCard-branded cards
(excluding Cirrus and Maestro) and for both MasterCard credit and charge programs and MasterCard debit and
prepaid programs in the United States and in all of our other regions for the years ended December 31, 2011 and
2010. Growth rates are provided on both a U.S. dollar and local currency basis for the periods indicated. GDV
represents the aggregate dollar amount of purchases made and cash disbursements obtained with MasterCard-
branded cards and includes the impact of balance transfers and convenience checks.
Year-over-year growth
Year ended
December 31,
2011
U.S.
$
Local
Currency2
Year ended
December 31,
2010
(in billions, except percentages)
All MasterCard Branded Programs
Asia Pacific/Middle East/Africa .............. $ 805 30.1% 22.9% $ 619
Canada .................................. 119 11.7% 7.3% 107
Europe .................................. 979 21.0% 16.7% 809
Latin America ............................ 277 25.5% 22.6% 220
Worldwide less United States ................ 2,180 24.2% 19.1% 1,755
United States ............................. 1,069 10.4% 10.4% 968
Worldwide ............................... $3,249 19.3% 16.1% $2,723
All MasterCard Credit and Charge Programs
Worldwide less United States ................ $1,521 21.2% 16.0% $1,255
United States ............................. 543 6.0% 6.0% 512
Worldwide ............................... $2,064 16.8% 13.2% $1,767
All MasterCard Debit and Prepaid Programs
Worldwide less United States ................ $ 659 31.8% 26.8% $ 500
United States ............................. 526 15.4% 15.4% 456
Worldwide ............................... $1,185 24.0% 21.5% $ 956
* Note that figures in the above table may not sum due to rounding.
1GDV generated by Maestro and Cirrus cards is not included. The data for GDV is provided by MasterCard
customers and includes information with respect to MasterCard-branded transactions that are not processed
by MasterCard and for which MasterCard does not earn significant revenues. All data is subject to revision
and amendment by MasterCard’s customers subsequent to the date of its release, which revisions and
amendments may be material.
2Local currency growth eliminates the impact of currency fluctuations and represents local market
performance.
Processed Transactions. The table below sets forth the total number of transactions processed by
MasterCard for the years ended December 31, 2011 and 2010:
Year ended
December 31, 2011 Year-over-year growth
Year ended
December 31, 2010
(in millions, except percentages)
Processed Transactions ............ 27,265 18.3% 23,052
18