MasterCard 2011 Annual Report Download - page 113
Download and view the complete annual report
Please find page 113 of the 2011 MasterCard annual report below. You can navigate through the pages in the report by either clicking on the pages listed below, or by using the keyword search tool below to find specific information within the annual report.-
 1
1 -
2
-
3
-
4
-
5
-
6
-
7
-
8
-
9
-
10
-
11
-
12
-
13
-
14
-
15
-
16
-
17
-
18
-
19
-
20
-
21
-
22
-
23
-
24
-
25
-
26
-
27
-
28
-
29
-
30
-
31
-
32
-
33
-
34
-
35
-
36
-
37
-
38
-
39
-
40
-
41
-
42
-
43
-
44
-
45
-
46
-
47
-
48
-
49
-
50
-
51
-
52
-
53
-
54
-
55
-
56
-
57
-
58
-
59
-
60
-
61
-
62
-
63
-
64
-
65
-
66
-
67
-
68
-
69
-
70
-
71
-
72
-
73
-
74
-
75
-
76
-
77
-
78
-
79
-
80
-
81
-
82
-
83
-
84
-
85
-
86
-
87
-
88
-
89
-
90
-
91
-
92
-
93
-
94
-
95
-
96
-
97
-
98
-
99
-
100
-
101
-
102
-
 103
103 -
 104
104 -
 105
105 -
 106
106 -
 107
107 -
 108
108 -
 109
109 -
 110
110 -
 111
111 -
 112
112 -
 113
113 -
 114
114 -
 115
115 -
 116
116 -
 117
117 -
 118
118 -
 119
119 -
 120
120 -
 121
121 -
 122
122 -
 123
123 -
124
-
125
-
126
-
127
-
128
-
129
-
130
-
131
-
132
-
133
-
134
-
135
-
136
-
137
-
138
-
139
-
140
-
141
-
142
-
143
-
144
-
145
-
146
-
147
-
148
-
149
-
150
-
151
-
152
-
153
-
154
-
155
-
156
 |
 |

MASTERCARD INCORPORATED
NOTES TO CONSOLIDATED FINANCIAL STATEMENTS—(Continued)
December 31, 2010
Quoted Prices
in Active
Markets
(Level 1)
Significant
Other
Observable
Inputs
(Level 2)
Significant
Unobservable
Inputs
(Level 3)
Fair
Value
(in millions)
Mutual funds:
Money market ........................ $ 3 $— $— $ 3
Domestic small cap equity ............... 36 — — 36
International equity .................... 35 — — 35
Common and collective funds:
Domestic large cap equity ............... — 94 — 94
Domestic fixed income ................. — 68 — 68
Total .................................... $ 74 $162 $— $236
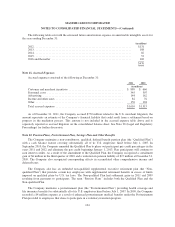
Pursuant to the requirements of the Pension Protection Act of 2006, the Company did not have a mandatory
contribution to the Qualified Plan in 2011, 2010 or 2009. However, the Company did make voluntary
contributions of $20 million, $20 million and $31 million to the Qualified Plan in 2011, 2010 and 2009,
respectively. Although not required in 2012, the Company may voluntarily elect to contribute to the Qualified
Plan. The Company currently estimates that it may contribute $10 million to the Qualified Plan in 2012. The
Company does not make any contributions to the Non-qualified Plan or to its Postretirement Plan other than
funding benefit payments.
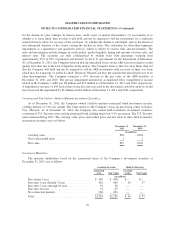
The following table summarizes expected benefit payments through 2021 for the Pension Plans and the
Postretirement Plan, including those payments expected to be paid from the Company’s general assets. Since the
majority of the benefit payments for the Pension Plans are made in the form of lump-sum distributions, actual
benefit payments may differ from expected benefit payments.
Postretirement Plan
Pension
Plans
Benefit
Payments
Expected
Subsidy
Receipts
Net Benefit
Payments
(in millions)
2012 ........................................ $17 $ 4 $— $ 4
2013 ........................................ 22 4 — 4
2014 ........................................ 21 4 — 4
2015 ........................................ 22 4 — 4
2016 ........................................ 19 4 — 4
2017—2021 .................................. 94 24 1 23
Savings Plan
Substantially all of the Company’s U.S. employees are eligible to participate in a defined contribution savings
plan (the “Savings Plan”) sponsored by the Company. The Savings Plan allows employees to contribute a portion of
their base compensation on a pre-tax and after-tax basis in accordance with specified guidelines. The Company
matches a percentage of employees’ contributions up to certain limits. In addition, the Company has several defined
contribution plans outside of the United States. The Company’s contribution expense related to all of its defined
contribution plans was $35 million, $33 million and $41 million for 2011, 2010 and 2009, respectively.
109