MasterCard 2011 Annual Report Download - page 64
Download and view the complete annual report
Please find page 64 of the 2011 MasterCard annual report below. You can navigate through the pages in the report by either clicking on the pages listed below, or by using the keyword search tool below to find specific information within the annual report.-
 1
1 -
2
-
3
-
4
-
5
-
6
-
7
-
8
-
9
-
10
-
11
-
12
-
13
-
14
-
15
-
16
-
17
-
18
-
19
-
20
-
21
-
22
-
23
-
24
-
25
-
26
-
27
-
28
-
29
-
30
-
31
-
32
-
33
-
34
-
35
-
36
-
37
-
38
-
39
-
40
-
41
-
42
-
43
-
44
-
45
-
46
-
47
-
48
-
49
-
50
-
51
-
52
-
53
-
 54
54 -
 55
55 -
 56
56 -
 57
57 -
 58
58 -
 59
59 -
 60
60 -
 61
61 -
 62
62 -
 63
63 -
 64
64 -
 65
65 -
 66
66 -
 67
67 -
 68
68 -
 69
69 -
 70
70 -
 71
71 -
 72
72 -
 73
73 -
 74
74 -
75
-
76
-
77
-
78
-
79
-
80
-
81
-
82
-
83
-
84
-
85
-
86
-
87
-
88
-
89
-
90
-
91
-
92
-
93
-
94
-
95
-
96
-
97
-
98
-
99
-
100
-
101
-
102
-
103
-
104
-
105
-
106
-
107
-
108
-
109
-
110
-
111
-
112
-
113
-
114
-
115
-
116
-
117
-
118
-
119
-
120
-
121
-
122
-
123
-
124
-
125
-
126
-
127
-
128
-
129
-
130
-
131
-
132
-
133
-
134
-
135
-
136
-
137
-
138
-
139
-
140
-
141
-
142
-
143
-
144
-
145
-
146
-
147
-
148
-
149
-
150
-
151
-
152
-
153
-
154
-
155
-
156
 |
 |

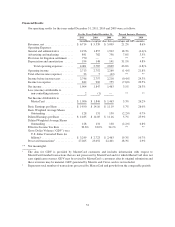
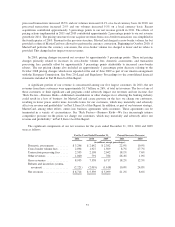
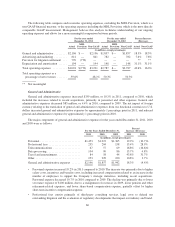
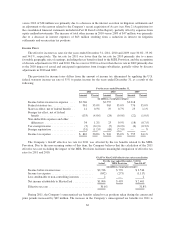
The following table compares and reconciles operating expenses, excluding the MDL Provision, which is a
non-GAAP financial measure, to the operating expenses including the MDL Provision, which is the most directly
comparable GAAP measurement. Management believes this analysis facilitates understanding of our ongoing
operating expenses and allows for a more meaningful comparison between periods.
For the year ended
December 31, 2011
For the year ended
December 31, 2010
Percent Increase
(Decrease)
Actual
MDL
Provision Non-GAAP Actual
MDL
Provision Non-GAAP Actual Non-GAAP
(in millions, except percentages)
General and administrative ......... $2,196 $ — $2,196 $1,857 $— $1,857 18.3% 18.3%
Advertising and marketing ......... 841 — 841 782 — 782 7.6% 7.6%
Provision for litigation settlement . . . 770 (770) — — — — ** **
Depreciation and amortization ...... 194 — 194 148 — 148 31.1% 31.1%
Total operating expenses .......... $4,001 $(770) $3,231 $2,787 $— $2,787 43.6% 16.0%
Total operating expenses as a
percentage of net revenues ....... 59.6% 48.1% 50.3% 50.3%
** Not meaningful
General and Administrative
General and administrative expenses increased $339 million, or 18.3% in 2011, compared to 2010, which
included the increases related to recent acquisitions, primarily in personnel and other expenses. General and
administrative expenses decreased $85 million, or 4.4% in 2010, compared to 2009. The net impact of foreign
currency relating to the translation of general and administrative expenses from our functional currencies to U.S.
dollars increased general and administrative expenses by approximately 1 percentage point in 2011, and reduced
general and administrative expenses by approximately 1 percentage point in 2010.
The major components of general and administrative expenses for the years ended December 31, 2011, 2010
and 2009 were as follows:
For the Years Ended December 31,
Percent
Increase (Decrease)
2011 2010 2009 2011 2010
(in millions, except percentages)
Personnel ............................ $1,453 $1,219 $1,365 19.2% (10.7)%
Professional fees ...................... 235 204 158 15.4% 28.9%
Telecommunications ................... 67 57 69 16.8% (16.6)%
Data processing ....................... 104 90 86 15.7% 4.8%
Travel and entertainment ................ 84 58 44 43.8% 31.7%
Other ............................... 253 229 220 10.8% 3.7%
General and administrative expenses ...... $2,196 $1,857 $1,942 18.3% (4.4)%
• Personnel expense increased 19.2% in 2011 compared to 2010. The increase was primarily due to higher
salary costs, incentives and benefits costs, including increased compensation related to an increase in the
number of employees to support the Company’s strategic initiatives, including recent acquisitions.
Personnel expense decreased 10.7% in 2010 compared to 2009. The decline was primarily due to lower
severance expense of $100 million, due to a realignment of resources in 2009, lower pension and other
retirement-related expenses, and lower share-based compensation expense, partially offset by higher
short-term incentive compensation expense.
• Professional fees consist primarily of third-party consulting services, legal costs to defend our
outstanding litigation and the evaluation of regulatory developments that impact our industry and brand.
60