MasterCard 2011 Annual Report Download - page 100
Download and view the complete annual report
Please find page 100 of the 2011 MasterCard annual report below. You can navigate through the pages in the report by either clicking on the pages listed below, or by using the keyword search tool below to find specific information within the annual report.-
 1
1 -
2
-
3
-
4
-
5
-
6
-
7
-
8
-
9
-
10
-
11
-
12
-
13
-
14
-
15
-
16
-
17
-
18
-
19
-
20
-
21
-
22
-
23
-
24
-
25
-
26
-
27
-
28
-
29
-
30
-
31
-
32
-
33
-
34
-
35
-
36
-
37
-
38
-
39
-
40
-
41
-
42
-
43
-
44
-
45
-
46
-
47
-
48
-
49
-
50
-
51
-
52
-
53
-
54
-
55
-
56
-
57
-
58
-
59
-
60
-
61
-
62
-
63
-
64
-
65
-
66
-
67
-
68
-
69
-
70
-
71
-
72
-
73
-
74
-
75
-
76
-
77
-
78
-
79
-
80
-
81
-
82
-
83
-
84
-
85
-
86
-
87
-
88
-
89
-
 90
90 -
 91
91 -
 92
92 -
 93
93 -
 94
94 -
 95
95 -
 96
96 -
 97
97 -
 98
98 -
 99
99 -
 100
100 -
 101
101 -
 102
102 -
 103
103 -
 104
104 -
 105
105 -
 106
106 -
 107
107 -
 108
108 -
 109
109 -
 110
110 -
111
-
112
-
113
-
114
-
115
-
116
-
117
-
118
-
119
-
120
-
121
-
122
-
123
-
124
-
125
-
126
-
127
-
128
-
129
-
130
-
131
-
132
-
133
-
134
-
135
-
136
-
137
-
138
-
139
-
140
-
141
-
142
-
143
-
144
-
145
-
146
-
147
-
148
-
149
-
150
-
151
-
152
-
153
-
154
-
155
-
156
 |
 |
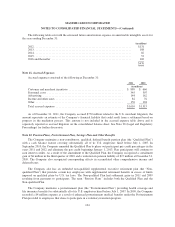
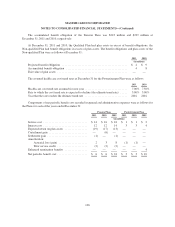
MASTERCARD INCORPORATED
NOTES TO CONSOLIDATED FINANCIAL STATEMENTS—(Continued)
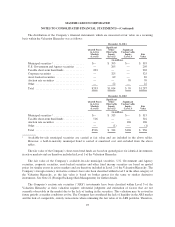
the Company used the income approach, which included a discounted cash flow analysis of the estimated future
cash flows adjusted by a risk premium for the ARS portfolio, to estimate the fair value of its ARS portfolio. The
Company estimated the fair value of its ARS portfolio to be a 10% discount to the par value as of
December 31, 2011 and 2010. When a determination is made to classify a financial instrument within Level 3,
the determination is based upon the significance of the unobservable parameters to the overall fair value
measurement. However, the fair value determination for Level 3 financial instruments may include observable
components.
Financial Instruments - Non-Recurring Measurements
Certain financial instruments are carried on the consolidated balance sheet at cost, which approximates fair
value due to their short-term, highly liquid nature. These instruments include cash and cash equivalents, accounts
receivable, settlement due from customers, restricted security deposits held for customers, prepaid expenses,
accounts payable, settlement due to customers and accrued expenses.
Investment Securities Held-to-Maturity
The Company utilizes quoted prices for similar securities from active markets to estimate the fair value of
its held-to-maturity securities. See Note 6 (Investment Securities) for fair value disclosure.
Debt
The Company estimates the fair value of its debt by applying a current period discount rate to the remaining
cash flows under the terms of the debt. As of December 31, 2010, the carrying values on the consolidated balance
sheet totaled $20 million and approximated fair value. The carrying value of the Company’s debt was included in
other current liabilities on the consolidated balance sheet and was repaid during the three months ended June 30,
2011.
Obligations Under Litigation Settlements
The Company estimates the fair value of its obligations under litigation settlements by applying a current
period discount rate to the remaining cash flows under the terms of the litigation settlements. At
December 31, 2011 and 2010, the carrying values on the consolidated balance sheet totaled $4 million and $302
million and the fair values totaled $4 million and $307 million, respectively, for these obligations. For additional
information regarding the Company’s obligations under litigation settlements, see Note 18 (Obligations Under
Litigation Settlements).
Settlement and Other Guarantee Liabilities
The Company estimates the fair value of its settlement and other guarantees by applying market
assumptions for relevant though not directly comparable undertakings, as the latter are not observable in the
market given the proprietary nature of such guarantees. Additionally, loss probability and severity profiles
against the Company’s gross and net settlement exposures are considered. At December 31, 2011 and 2010, the
carrying value of settlement and other guarantee liabilities were de minimis. The estimated fair values of
settlement and other guarantee liabilities as of December 31, 2011 and 2010 were approximately $95 million and
$45 million, respectively. For additional information regarding the Company’s settlement and other guarantee
liabilities, see Note 21 (Settlement and Other Risk Management).
96