MasterCard 2011 Annual Report Download - page 62
Download and view the complete annual report
Please find page 62 of the 2011 MasterCard annual report below. You can navigate through the pages in the report by either clicking on the pages listed below, or by using the keyword search tool below to find specific information within the annual report.-
 1
1 -
2
-
3
-
4
-
5
-
6
-
7
-
8
-
9
-
10
-
11
-
12
-
13
-
14
-
15
-
16
-
17
-
18
-
19
-
20
-
21
-
22
-
23
-
24
-
25
-
26
-
27
-
28
-
29
-
30
-
31
-
32
-
33
-
34
-
35
-
36
-
37
-
38
-
39
-
40
-
41
-
42
-
43
-
44
-
45
-
46
-
47
-
48
-
49
-
50
-
51
-
 52
52 -
 53
53 -
 54
54 -
 55
55 -
 56
56 -
 57
57 -
 58
58 -
 59
59 -
 60
60 -
 61
61 -
 62
62 -
 63
63 -
 64
64 -
 65
65 -
 66
66 -
 67
67 -
 68
68 -
 69
69 -
 70
70 -
 71
71 -
 72
72 -
73
-
74
-
75
-
76
-
77
-
78
-
79
-
80
-
81
-
82
-
83
-
84
-
85
-
86
-
87
-
88
-
89
-
90
-
91
-
92
-
93
-
94
-
95
-
96
-
97
-
98
-
99
-
100
-
101
-
102
-
103
-
104
-
105
-
106
-
107
-
108
-
109
-
110
-
111
-
112
-
113
-
114
-
115
-
116
-
117
-
118
-
119
-
120
-
121
-
122
-
123
-
124
-
125
-
126
-
127
-
128
-
129
-
130
-
131
-
132
-
133
-
134
-
135
-
136
-
137
-
138
-
139
-
140
-
141
-
142
-
143
-
144
-
145
-
146
-
147
-
148
-
149
-
150
-
151
-
152
-
153
-
154
-
155
-
156
 |
 |
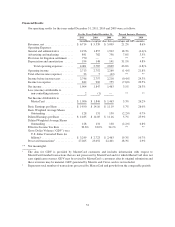
Domestic assessments—There was an increase in domestic assessments of 22.9% and 10.9% during 2011
and 2010, respectively, primarily due to the following:
• GDV increased 16.1% in 2011, when measured in local currency terms, and increased 19.3% when
measured on a U.S. dollar-converted basis, versus the comparable periods in 2010. In 2010, GDV
increased 9.1% when measured in local currency terms, and increased 10.7% when measured on a U.S.
dollar-converted basis, versus 2009.
• Pricing changes increased domestic assessments by approximately 5 and 4 percentage points for 2011
and 2010, respectively.
• The net impact of foreign currency relating to the translation of domestic assessments from our
functional currencies to U.S. dollars favorably impacted domestic assessments revenue growth by
approximately 2 percentage points in 2011, and impacted revenue growth by a minimal amount in 2010.
Cross-border volume fees—There was an increase in cross-border volume fees of 8.7% and 27.7% during
2011 and 2010, respectively, primarily due to the following:
• Cross-border volumes increased 18.7% in 2011 when measured in local currency terms, and increased
24.2% when measured on a U.S. dollar-converted basis, versus the comparable periods in 2010. In 2010,
cross-border volumes increased 15.2% when measured in local currency terms and increased 15.1%
when measured on a U.S. dollar-converted basis.
• Pricing changes reduced cross-border revenue by approximately 11 percentage points in 2011. This
decrease was due to pricing changes related to the pricing structure change implemented in October
2010 and was partially offset by pricing increases implemented during 2010. In 2010, pricing changes
represented approximately a net 13 percentage points of cross-border revenue growth. This increase
included approximately 18 percentage points related to pricing changes implemented in October 2009,
partially offset by a decrease due to the pricing structure change in October 2010. Furthermore, the
October 2008 pricing changes which were repealed at the end of June 2009 as part of our interim
arrangement with the European Commission had an approximate 2 percentage point negative impact on
2010 cross-border revenue growth.
• The net impact of foreign currency relating to the translation of cross-border volume fees from our
functional currencies to U.S. dollars favorably impacted cross-border volume fees revenue growth by
approximately 1 percentage point in 2011, and unfavorably impacted revenue growth by approximately
2 percentage points in 2010.
Transaction processing fees—There was an increase in transaction processing fees of 18.1% and 7.6%
during 2011 and 2010, respectively, primarily due to the following:
• Processed transactions increased 18.3% and 2.9% during 2011 and 2010, respectively.
• The effects of connectivity fees and other non-switching transactions also contributed to the growth in
transaction processing fees in 2011. The 2010 growth in transaction processing was partially offset from
the effects of prior debit portfolio losses in the U.S. and U.K. Those debit portfolio losses impacted
revenue to a lessor extent than the percentage decrease in the transactions due to the pricing of those
products and portfolios.
• Pricing changes in 2011 had a minimal impact on processed transactions fees, while in 2010, pricing
changes implemented in April 2009 represented approximately 3 percentage points of the increase.
• The net impact of foreign currency relating to the translation of transaction processing fees from our
functional currencies to U.S. dollars favorably impacted transaction processing fees revenue growth by
approximately 2 percentage points in 2011, and unfavorably impacted revenue growth by approximately
1 percentage point in 2010.
58