Kraft 2013 Annual Report Download - page 80
Download and view the complete annual report
Please find page 80 of the 2013 Kraft annual report below. You can navigate through the pages in the report by either clicking on the pages listed below, or by using the keyword search tool below to find specific information within the annual report.-
 1
1 -
2
-
3
-
4
-
5
-
6
-
7
-
8
-
9
-
10
-
11
-
12
-
13
-
14
-
15
-
16
-
17
-
18
-
19
-
20
-
21
-
22
-
23
-
24
-
25
-
26
-
27
-
28
-
29
-
30
-
31
-
32
-
33
-
34
-
35
-
36
-
37
-
38
-
39
-
40
-
41
-
42
-
43
-
44
-
45
-
46
-
47
-
48
-
49
-
50
-
51
-
52
-
53
-
54
-
55
-
56
-
57
-
58
-
59
-
60
-
61
-
62
-
63
-
64
-
65
-
66
-
67
-
68
-
69
-
 70
70 -
 71
71 -
 72
72 -
 73
73 -
 74
74 -
 75
75 -
 76
76 -
 77
77 -
 78
78 -
 79
79 -
 80
80 -
 81
81 -
 82
82 -
 83
83 -
 84
84 -
 85
85 -
 86
86 -
 87
87 -
 88
88 -
 89
89 -
 90
90 -
91
-
92
 |
 |
78
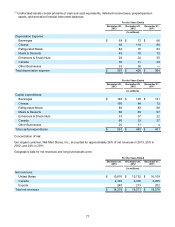
As of
December 28,
2013 December 29,
2012
(in millions)
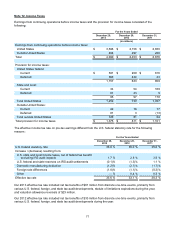
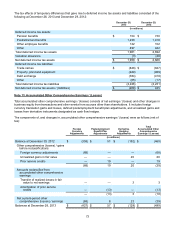
Long-lived assets:
United States $ 16,516 $ 16,434
Canada 1,724 1,922
Total long-lived assets $ 18,240 $ 18,356
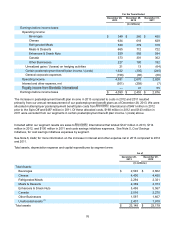
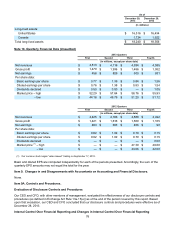
Note 16. Quarterly Financial Data (Unaudited)
2013 Quarters
First Second Third Fourth
(in millions, except per share data)
Net revenues $ 4,513 $ 4,716 $ 4,394 $ 4,595
Gross profit $ 1,470 $ 1,936 $ 1,486 $ 1,932
Net earnings $ 456 $ 829 $ 500 $ 931
Per share data:
Basic earnings per share $ 0.77 $ 1.39 $ 0.84 $ 1.56
Diluted earnings per share $ 0.76 $ 1.38 $ 0.83 $ 1.54
Dividends declared $ 0.50 $ 0.50 $ — $ 1.05
Market price – high $ 52.29 $ 57.84 $ 58.76 $ 55.93
– low $ 44.16 $ 49.79 $ 51.20 $ 51.72
2012 Quarters
First Second Third Fourth
(in millions, except per share data)
Net revenues $ 4,425 $ 4,766 $ 4,588 $ 4,492
Gross profit $ 1,421 $ 1,616 $ 1,569 $ 1,165
Net earnings $ 483 $ 603 $ 466 $ 90
Per share data:
Basic earnings per share $ 0.82 $ 1.02 $ 0.79 $ 0.15
Diluted earnings per share $ 0.82 $ 1.02 $ 0.79 $ 0.15
Dividends declared $ — $ — $ — $ 0.50
Market price (1) – high $ — $ — $ 47.30 $ 48.00
– low $ — $ — $ 43.06 $ 42.00
(1) Our common stock began “when issued” trading on September 17, 2012.
Basic and diluted EPS are computed independently for each of the periods presented. Accordingly, the sum of the
quarterly EPS amounts may not equal the total for the year.
Item 9. Changes in and Disagreements with Accountants on Accounting and Financial Disclosure.
None.
Item 9A. Controls and Procedures.
Evaluation of Disclosure Controls and Procedures
Our CEO and CFO, with other members of management, evaluated the effectiveness of our disclosure controls and
procedures (as defined in Exchange Act Rule 13a-15(e)) as of the end of the period covered by this report. Based
upon that evaluation, our CEO and CFO concluded that our disclosure controls and procedures were effective as of
December 28, 2013.
Internal Control Over Financial Reporting and Changes in Internal Control Over Financial Reporting