Kraft 2013 Annual Report Download - page 5
Download and view the complete annual report
Please find page 5 of the 2013 Kraft annual report below. You can navigate through the pages in the report by either clicking on the pages listed below, or by using the keyword search tool below to find specific information within the annual report.-
 1
1 -
 2
2 -
 3
3 -
 4
4 -
 5
5 -
 6
6 -
 7
7 -
 8
8 -
 9
9 -
 10
10 -
 11
11 -
 12
12 -
 13
13 -
 14
14 -
 15
15 -
 16
16 -
17
-
18
-
19
-
20
-
21
-
22
-
23
-
24
-
25
-
26
-
27
-
28
-
29
-
30
-
31
-
32
-
33
-
34
-
35
-
36
-
37
-
38
-
39
-
40
-
41
-
42
-
43
-
44
-
45
-
46
-
47
-
48
-
49
-
50
-
51
-
52
-
53
-
54
-
55
-
56
-
57
-
58
-
59
-
60
-
61
-
62
-
63
-
64
-
65
-
66
-
67
-
68
-
69
-
70
-
71
-
72
-
73
-
74
-
75
-
76
-
77
-
78
-
79
-
80
-
81
-
82
-
83
-
84
-
85
-
86
-
87
-
88
-
89
-
90
-
91
-
92
 |
 |

3
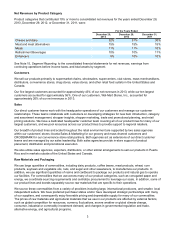
Net Revenues by Product Category
Product categories that contributed 10% or more to consolidated net revenues for the years ended December 28,
2013, December 29, 2012, or December 31, 2011, were:
For the Years Ended
December 28,
2013 December 29,
2012 December 31,
2011
Cheese and dairy 32% 31% 30%
Meat and meat alternatives 15% 15% 15%
Meals 11% 11% 10%
Refreshment Beverages 10% 10% 11%
Enhancers 9% 10% 10%
See Note 15, Segment Reporting, to the consolidated financial statements for net revenues, earnings from
continuing operations before income taxes, and total assets by segment.
Customers
We sell our products primarily to supermarket chains, wholesalers, supercenters, club stores, mass merchandisers,
distributors, convenience stores, drug stores, value stores, and other retail food outlets in the United States and
Canada.
Our five largest customers accounted for approximately 43% of our net revenues in 2013, while our ten largest
customers accounted for approximately 56%. One of our customers, Wal-Mart Stores, Inc., accounted for
approximately 26% of our net revenues in 2013.
Sales
Our direct customer teams work with the headquarter operations of our customers and manage our customer
relationships. These teams collaborate with customers on developing strategies for new item introduction, category
and assortment management, shopper insights, shopper marketing, trade and promotional planning, and retail
pricing solutions. We have a dedicated headquarter customer team covering all of our product lines for many of our
largest customers, and we pool resources across our product lines to provide support to regional retailers.
Our breadth of product lines and scale throughout the retail environment are supported by two sales agencies
within our customers’ stores: Acosta Sales & Marketing for our grocery and mass channel customers and
CROSSMARK for our convenience store retail partners. Both agencies act as extensions of our direct customer
teams and are managed by our sales leadership. Both sales agencies provide in-store support of product
placement, distribution and promotional execution.
We also utilize sales agencies, exporters, distributors, or other similar arrangements to sell our products in Puerto
Rico and in markets outside of the United States and Canada.
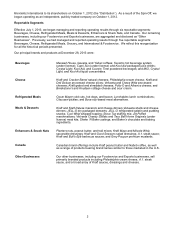
Raw Materials and Packaging
We use large quantities of commodities, including dairy products, coffee beans, meat products, wheat, corn
products, soybean and vegetable oils, nuts, and sugar and other sweeteners, to manufacture our products. In
addition, we use significant quantities of resins and cardboard to package our products and natural gas to operate
our facilities. For commodities that we use across many of our product categories, such as corrugated paper and
energy, we coordinate sourcing requirements and centralize procurement to leverage our scale. In addition, some of
our product lines and brands separately source raw materials that are specific to their operations.
We source these commodities from a variety of providers including large, international producers, and smaller, local
independent sellers. We have preferred purchaser status and/or have developed strategic partnerships with many
of our suppliers, and consequently enjoy favorable pricing and dependable supply for many of our commodities.
The prices of raw materials and agricultural materials that we use in our products are affected by external factors,
such as global competition for resources, currency fluctuations, severe weather or global climate change,
consumer, industrial or commodity investment demand, and changes in governmental regulation and trade,
alternative energy, and agricultural programs.