Kraft 2013 Annual Report Download - page 25
Download and view the complete annual report
Please find page 25 of the 2013 Kraft annual report below. You can navigate through the pages in the report by either clicking on the pages listed below, or by using the keyword search tool below to find specific information within the annual report.-
 1
1 -
2
-
3
-
4
-
5
-
6
-
7
-
8
-
9
-
10
-
11
-
12
-
13
-
14
-
 15
15 -
 16
16 -
 17
17 -
 18
18 -
 19
19 -
 20
20 -
 21
21 -
 22
22 -
 23
23 -
 24
24 -
 25
25 -
 26
26 -
 27
27 -
 28
28 -
 29
29 -
 30
30 -
 31
31 -
 32
32 -
 33
33 -
 34
34 -
 35
35 -
36
-
37
-
38
-
39
-
40
-
41
-
42
-
43
-
44
-
45
-
46
-
47
-
48
-
49
-
50
-
51
-
52
-
53
-
54
-
55
-
56
-
57
-
58
-
59
-
60
-
61
-
62
-
63
-
64
-
65
-
66
-
67
-
68
-
69
-
70
-
71
-
72
-
73
-
74
-
75
-
76
-
77
-
78
-
79
-
80
-
81
-
82
-
83
-
84
-
85
-
86
-
87
-
88
-
89
-
90
-
91
-
92
 |
 |

23
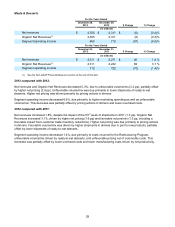
The change in market-based impacts to postemployment benefit plans increased operating income by $1,784
million as we recorded income from market-based impacts to our postemployment benefit plans of $1,561 million in
2013 (which consisted of income of $1,635 million from changes in discount rates and excess asset returns,
partially offset by expense of $74 million from changes in actuarial assumptions) compared to a net expense of
$223 million in 2012 (which consisted of expense of $594 million from changes in actuarial assumptions, partially
offset by excess asset returns of $371 million).
2012 compared with 2011:
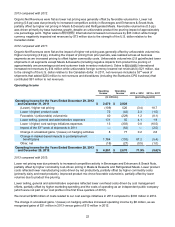
Higher net pricing outpaced increased product costs during 2012. The increase in product costs was due to higher
commodity costs, partially offset by lower manufacturing costs driven by net productivity. Unfavorable volume/mix
reflected customer trade inventory reductions and the impact of higher pricing.
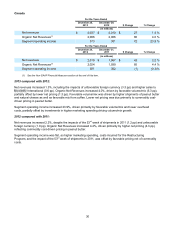
Total selling, general and administrative expenses decreased $55 million in 2012 from 2011, despite an increase in
marketing spending. The 53rd week of shipments in 2011 had an unfavorable year-over-year impact on operating
income of $62 million.
We recorded expenses related to our costs savings initiatives of $303 million in 2012, compared to none in 2011.
The change in unrealized gains/losses on hedging activities increased operating income by $77 million, as we
recognized gains of $13 million in 2012, versus losses of $64 million in 2011.
The change in market-based impacts to postemployment benefit plans decreased operating income by $153
million, as we recorded a mark-to-market expense of $223 million in 2012 (which consists of expense of $594
million from changes in actuarial assumptions, partially offset by excess asset returns of $371 million), versus a
mark-to-market expense of $70 million in 2011.
Included in other, net is the impact of divestitures (primarily the Starbucks CPG business cessation) which
decreased operating income by $20 million.
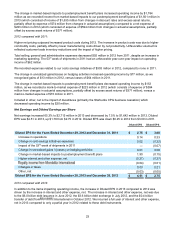
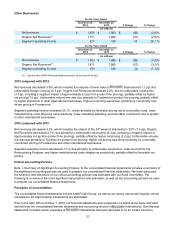
Net Earnings and Diluted Earnings per Share
Net earnings increased 65.3% to $2,715 million in 2013 and decreased by 7.5% to $1,642 million in 2012. Diluted
EPS was $4.51 in 2013, up $1.76 from $2.75 in 2012. Diluted EPS was down $0.25 in 2012 from $3.00 in 2011.
Diluted EPS Diluted EPS
Diluted EPS for the Years Ended December 29, 2012 and December 31, 2011 $ 2.75 $ 3.00
Increase in operations 0.14 0.33
Change in cost savings initiatives expenses 0.02 (0.32)
Impact of the 53rd week of shipments in 2011 — (0.07)
Change in unrealized gains / (losses) on hedging activities 0.01 0.08
Change in market-based impacts to postemployment benefit plans 1.90 (0.15)
Higher interest and other expense, net (0.27) (0.27)
(0.04) (0.01)
Changes in taxes 0.03 0.21
Other, net (0.03) (0.05)
Diluted EPS for the Years Ended December 28, 2013 and December 29, 2012 $ 4.51 $ 2.75
2013 compared with 2012:
In addition to the items impacting operating income, the increase in Diluted EPS in 2013 compared to 2012 was
driven by the increase in interest and other expense, net. The increase in interest and other expense, net was due
to the $6.0 billion debt issuance in June 2012, the $3.6 billion debt exchange in July 2012, and the $0.4 billion
transfer of debt from International in October 2012. We incurred a full year of interest and other expense,
net in 2013 compared to only a partial year in 2012 related to these debt instruments.