Kraft 2013 Annual Report Download - page 32
Download and view the complete annual report
Please find page 32 of the 2013 Kraft annual report below. You can navigate through the pages in the report by either clicking on the pages listed below, or by using the keyword search tool below to find specific information within the annual report.-
 1
1 -
2
-
3
-
4
-
5
-
6
-
7
-
8
-
9
-
10
-
11
-
12
-
13
-
14
-
15
-
16
-
17
-
18
-
19
-
20
-
21
-
 22
22 -
 23
23 -
 24
24 -
 25
25 -
 26
26 -
 27
27 -
 28
28 -
 29
29 -
 30
30 -
 31
31 -
 32
32 -
 33
33 -
 34
34 -
 35
35 -
 36
36 -
 37
37 -
 38
38 -
 39
39 -
 40
40 -
 41
41 -
 42
42 -
43
-
44
-
45
-
46
-
47
-
48
-
49
-
50
-
51
-
52
-
53
-
54
-
55
-
56
-
57
-
58
-
59
-
60
-
61
-
62
-
63
-
64
-
65
-
66
-
67
-
68
-
69
-
70
-
71
-
72
-
73
-
74
-
75
-
76
-
77
-
78
-
79
-
80
-
81
-
82
-
83
-
84
-
85
-
86
-
87
-
88
-
89
-
90
-
91
-
92
 |
 |
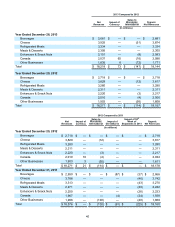
30
Canada
For the Years Ended
December 28,
2013 December 29,
2012 $ Change % Change
(in millions)
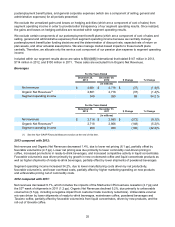
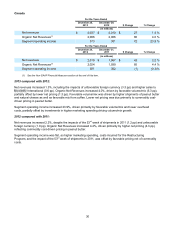
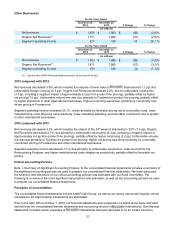
Net revenues $ 2,037 $ 2,010 $ 27 1.3 %
Organic Net Revenues(1) 2,086 2,006 80 4.0 %
Segment operating income 373 301 72 23.9 %
For the Years Ended
December 29,
2012 December 31,
2011 $ Change % Change
(in millions)
Net revenues $ 2,010 $ 1,967 $ 43 2.2 %
Organic Net Revenues(1) 2,024 1,939 85 4.4 %
Segment operating income 301 302 (1) (0.3)%
(1) See the Non-GAAP Financial Measures section at the end of this item.
2013 compared with 2012:
Net revenues increased 1.3%, including the impacts of unfavorable foreign currency (3.3 pp) and higher sales to
International (0.6 pp). Organic Net Revenues increased 4.0%, driven by favorable volume/mix (5.3 pp),
partially offset by lower net pricing (1.3 pp). Favorable volume/mix was driven by higher shipments of peanut butter
and natural cheese as well as favorable mix from coffee. Lower net pricing was due primarily to commodity cost-
driven pricing in peanut butter.
Segment operating income increased 23.9%, driven primarily by favorable volume/mix and lower overhead
costs, partially offset by investments in higher marketing spending driving volume/mix growth.
2012 compared with 2011:
Net revenues increased 2.2%, despite the impacts of the 53rd week of shipments in 2011 (1.2 pp) and unfavorable
foreign currency (1.0 pp). Organic Net Revenues increased 4.4%, driven primarily by higher net pricing (4.3 pp),
reflecting commodity cost-driven pricing in peanut butter.
Segment operating income was flat, as higher marketing spending, costs incurred for the Restructuring
Program, and the impact of the 53rd week of shipments in 2011, was offset by favorable pricing net of commodity
costs.