Kraft 2013 Annual Report Download - page 79
Download and view the complete annual report
Please find page 79 of the 2013 Kraft annual report below. You can navigate through the pages in the report by either clicking on the pages listed below, or by using the keyword search tool below to find specific information within the annual report.-
 1
1 -
2
-
3
-
4
-
5
-
6
-
7
-
8
-
9
-
10
-
11
-
12
-
13
-
14
-
15
-
16
-
17
-
18
-
19
-
20
-
21
-
22
-
23
-
24
-
25
-
26
-
27
-
28
-
29
-
30
-
31
-
32
-
33
-
34
-
35
-
36
-
37
-
38
-
39
-
40
-
41
-
42
-
43
-
44
-
45
-
46
-
47
-
48
-
49
-
50
-
51
-
52
-
53
-
54
-
55
-
56
-
57
-
58
-
59
-
60
-
61
-
62
-
63
-
64
-
65
-
66
-
67
-
68
-
 69
69 -
 70
70 -
 71
71 -
 72
72 -
 73
73 -
 74
74 -
 75
75 -
 76
76 -
 77
77 -
 78
78 -
 79
79 -
 80
80 -
 81
81 -
 82
82 -
 83
83 -
 84
84 -
 85
85 -
 86
86 -
 87
87 -
 88
88 -
 89
89 -
90
-
91
-
92
 |
 |

77
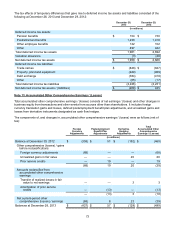
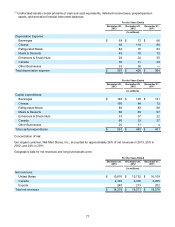
(1) Unallocated assets consist primarily of cash and cash equivalents, deferred income taxes, prepaid pension
assets, and derivative financial instrument balances.
For the Years Ended
December 28,
2013 December 29,
2012 December 31,
2011
(in millions)
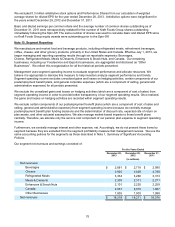
Depreciation Expense:
Beverages $ 69 $ 72 $ 66
Cheese 92 119 80
Refrigerated Meals 84 76 83
Meals & Desserts 49 70 72
Enhancers & Snack Nuts 28 24 25
Canada 38 31 38
Other Businesses 33 36 —
Total depreciation expense $ 393 $ 428 $ 364
For the Years Ended
December 28,
2013 December 29,
2012 December 31,
2011
(in millions)
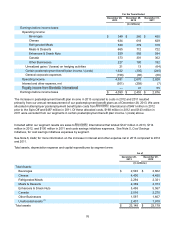
Capital expenditures:
Beverages $ 146 $ 129 $ 121
Cheese 150 84 72
Refrigerated Meals 80 83 88
Meals & Desserts 68 63 57
Enhancers & Snack Nuts 33 37 22
Canada 60 33 37
Other Businesses 20 11 4
Total capital expenditures $ 557 $ 440 $ 401
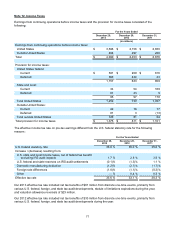
Concentration of risk:
Our largest customer, Wal-Mart Stores, Inc., accounted for approximately 26% of net revenues in 2013, 25% in
2012, and 24% in 2011.
Geographic data for net revenues and long-lived assets were:
For the Years Ended
December 28,
2013 December 29,
2012 December 31,
2011
(in millions)
Net revenues:
United States $ 15,676 $ 15,752 $ 16,109
Canada 2,302 2,306 2,265
Exports 240 213 202
Total net revenues $ 18,218 $ 18,271 $ 18,576