Kraft 2013 Annual Report Download - page 49
Download and view the complete annual report
Please find page 49 of the 2013 Kraft annual report below. You can navigate through the pages in the report by either clicking on the pages listed below, or by using the keyword search tool below to find specific information within the annual report.-
 1
1 -
2
-
3
-
4
-
5
-
6
-
7
-
8
-
9
-
10
-
11
-
12
-
13
-
14
-
15
-
16
-
17
-
18
-
19
-
20
-
21
-
22
-
23
-
24
-
25
-
26
-
27
-
28
-
29
-
30
-
31
-
32
-
33
-
34
-
35
-
36
-
37
-
38
-
 39
39 -
 40
40 -
 41
41 -
 42
42 -
 43
43 -
 44
44 -
 45
45 -
 46
46 -
 47
47 -
 48
48 -
 49
49 -
 50
50 -
 51
51 -
 52
52 -
 53
53 -
 54
54 -
 55
55 -
 56
56 -
 57
57 -
 58
58 -
 59
59 -
60
-
61
-
62
-
63
-
64
-
65
-
66
-
67
-
68
-
69
-
70
-
71
-
72
-
73
-
74
-
75
-
76
-
77
-
78
-
79
-
80
-
81
-
82
-
83
-
84
-
85
-
86
-
87
-
88
-
89
-
90
-
91
-
92
 |
 |
47
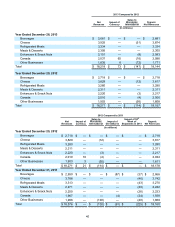
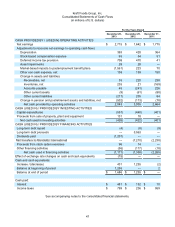
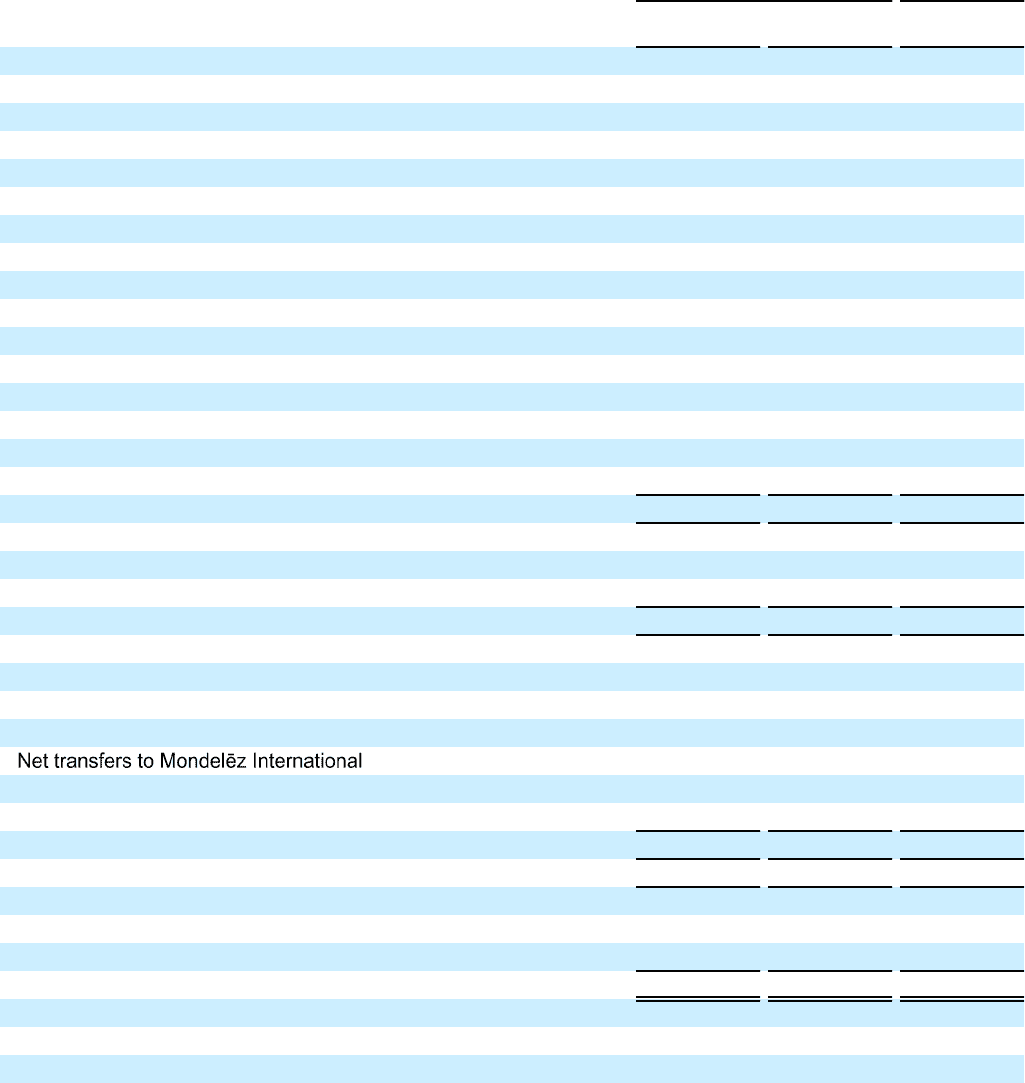
Kraft Foods Group, Inc.
Consolidated Statements of Cash Flows
(in millions of U.S. dollars)
For the Years Ended
December 28,
2013 December 29,
2012 December 31,
2011
CASH PROVIDED BY / (USED IN) OPERATING ACTIVITIES
Net earnings $ 2,715 $ 1,642 $ 1,775
Adjustments to reconcile net earnings to operating cash flows:
Depreciation 393 428 364
Stock-based compensation expense 65 54 51
Deferred income tax provision 708 470 41
Asset impairments 28 28 —
Market-based impacts to postemployment benefit plans (1,561) 223 70
Other non-cash expense, net 138 159 150
Change in assets and liabilities:
Receivables, net 35 220 238
Inventories, net 235 21 (169)
Accounts payable 45 (241) 226
Other current assets (9) (61) (88)
Other current liabilities (217) 205 84
Change in pension and postretirement assets and liabilities, net (532) (113) (78)
Net cash provided by operating activities 2,043 3,035 2,664
CASH (USED IN) / PROVIDED BY INVESTING ACTIVITIES
Capital expenditures (557) (440) (401)
Proceeds from sale of property, plant and equipment 131 18 —
Net cash used in investing activities (426) (422) (401)
CASH (USED IN) / PROVIDED BY FINANCING ACTIVITIES
Long-term debt repaid (4) (8) (9)
Long-term debt proceeds — 5,963 —
Dividends paid (1,207) — —
— (7,210) (2,238)
Proceeds from stock option exercises 96 14 —
Other financing activities (56) (117) (18)
Net cash used in financing activities (1,171) (1,358) (2,265)
Effect of exchange rate changes on cash and cash equivalents (15) — —
Cash and cash equivalents:
Increase / (decrease) 431 1,255 (2)
Balance at beginning of period 1,255 — 2
Balance at end of period $ 1,686 $ 1,255 $ —
Cash paid:
Interest $ 481 $ 152 $ 10
Income taxes $ 799 $ 236 $ 959
See accompanying notes to the consolidated financial statements.