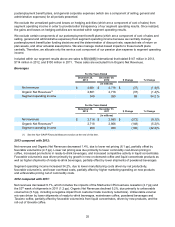
Kraft 2013 Annual Report Download - page 21
Download and view the complete annual report
Please find page 21 of the 2013 Kraft annual report below. You can navigate through the pages in the report by either clicking on the pages listed below, or by using the keyword search tool below to find specific information within the annual report.-
 1
1 -
2
-
3
-
4
-
5
-
6
-
7
-
8
-
9
-
10
-
 11
11 -
 12
12 -
 13
13 -
 14
14 -
 15
15 -
 16
16 -
 17
17 -
 18
18 -
 19
19 -
 20
20 -
 21
21 -
 22
22 -
 23
23 -
 24
24 -
 25
25 -
 26
26 -
 27
27 -
 28
28 -
 29
29 -
 30
30 -
 31
31 -
32
-
33
-
34
-
35
-
36
-
37
-
38
-
39
-
40
-
41
-
42
-
43
-
44
-
45
-
46
-
47
-
48
-
49
-
50
-
51
-
52
-
53
-
54
-
55
-
56
-
57
-
58
-
59
-
60
-
61
-
62
-
63
-
64
-
65
-
66
-
67
-
68
-
69
-
70
-
71
-
72
-
73
-
74
-
75
-
76
-
77
-
78
-
79
-
80
-
81
-
82
-
83
-
84
-
85
-
86
-
87
-
88
-
89
-
90
-
91
-
92
 |
 |
19
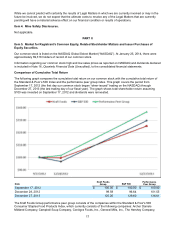
Item 6. Selected Financial Data.
Kraft Foods Group, Inc.
Selected Financial Data – Five Year Review
December 28,
2013 December 29,
2012 December 31,
2011 December 31,
2010 December 31,
2009
(in millions of dollars, except per share data)
Year Ended:
Net revenues $ 18,218 $ 18,271 $ 18,576 $ 17,739 $ 17,232
Earnings from continuing operations 2,715 1,642 1,775 1,890 1,896
Earnings and gain from discontinued
operations, net of income taxes — — — 1,644 218
Net earnings $ 2,715 $ 1,642 $ 1,775 $ 3,534 $ 2,114
Earnings from continuing operations per
share(1):
Basic $ 4.55 $ 2.77 $ 3.00 $ 3.20 $ 3.21
Diluted $ 4.51 $ 2.75 $ 3.00 $ 3.20 $ 3.21
Net cash provided by operating activities $ 2,043 $ 3,035 $ 2,664 $ 828 $ 3,017
Capital expenditures 557 440 401 448 513
Depreciation 393 428 364 354 348
As of:
Total assets 23,148 23,179 21,389 21,448 22,039
Long-term debt 9,976 9,966 27 31 48
Total equity 5,187 3,572 16,588 17,037 17,511
Dividends declared per share $ 2.05 $ 0.50 $ — $ — $ —
(1) On October 1, 2012, International distributed 592 million shares of Kraft Foods Group common stock to
International’s shareholders. Basic and diluted earnings per common share and the average number of common shares outstanding were
retrospectively restated for the years ended December 31, 2011, December 31, 2010, and December 31, 2009 for the number of Kraft
Foods Group shares outstanding immediately following this transaction.
Item 7. Management’s Discussion and Analysis of Financial Condition and Results of Operations.
The following discussion should be read in conjunction with the other sections of this Annual Report on Form 10-K,
including the consolidated financial statements and related notes contained in Item 8.
Description of the Company
We manufacture and market food and beverage products, including refrigerated meals, refreshment beverages,
coffee, cheese, and other grocery products, primarily in the United States and Canada. Our product categories
span all major meal occasions, both at home and in foodservice locations.
We were a wholly owned subsidiary of International until October 1, 2012. On that date,
International spun-off Kraft Foods Group, comprising the North American grocery business, to
International’s shareholders. As a result of the Spin-Off, we now operate as an independent publicly traded
company.