Kraft 2013 Annual Report Download - page 29
Download and view the complete annual report
Please find page 29 of the 2013 Kraft annual report below. You can navigate through the pages in the report by either clicking on the pages listed below, or by using the keyword search tool below to find specific information within the annual report.-
 1
1 -
2
-
3
-
4
-
5
-
6
-
7
-
8
-
9
-
10
-
11
-
12
-
13
-
14
-
15
-
16
-
17
-
18
-
 19
19 -
 20
20 -
 21
21 -
 22
22 -
 23
23 -
 24
24 -
 25
25 -
 26
26 -
 27
27 -
 28
28 -
 29
29 -
 30
30 -
 31
31 -
 32
32 -
 33
33 -
 34
34 -
 35
35 -
 36
36 -
 37
37 -
 38
38 -
 39
39 -
40
-
41
-
42
-
43
-
44
-
45
-
46
-
47
-
48
-
49
-
50
-
51
-
52
-
53
-
54
-
55
-
56
-
57
-
58
-
59
-
60
-
61
-
62
-
63
-
64
-
65
-
66
-
67
-
68
-
69
-
70
-
71
-
72
-
73
-
74
-
75
-
76
-
77
-
78
-
79
-
80
-
81
-
82
-
83
-
84
-
85
-
86
-
87
-
88
-
89
-
90
-
91
-
92
 |
 |

27
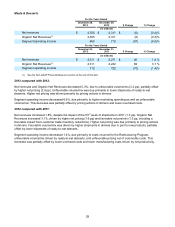
Refrigerated Meals
For the Years Ended
December 28,
2013 December 29,
2012 $ Change % Change
(in millions)
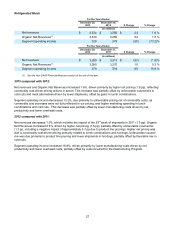
Net revenues $3,334 $ 3,280 $ 54 1.6 %
Organic Net Revenues(1) 3,334 3,280 54 1.6 %
Segment operating income 329 379 (50) (13.2)%
For the Years Ended
December 29,
2012 December 31,
2011 $ Change % Change
(in millions)
Net revenues $3,280 $ 3,313 $ (33) (1.0)%
Organic Net Revenues(1) 3,280 3,270 10 0.3 %
Segment operating income 379 319 60 18.8 %
(1) See the Non-GAAP Financial Measures section at the end of this item.
2013 compared with 2012:
Net revenues and Organic Net Revenues increased 1.6%, driven primarily by higher net pricing (1.9 pp), reflecting
commodity cost-driven pricing actions in bacon. This increase was partially offset by unfavorable volume/mix in
cold cuts and meat alternatives driven by lower shipments, offset by gains in lunch combinations.
Segment operating income decreased 13.2%, due primarily to unfavorable pricing net of commodity costs, as
commodity cost increases were not fully reflected in our pricing, and higher marketing spending in lunch
combinations and cold cuts. This decrease was partially offset by lower manufacturing costs driven by net
productivity and lower overhead costs.
2012 compared with 2011:
Net revenues decreased 1.0%, which includes the impact of the 53rd week of shipments in 2011 (1.3 pp). Organic
Net Revenues increased 0.3%, driven by higher net pricing (1.6 pp), partially offset by unfavorable volume/mix
(1.3 pp, including a negative impact of approximately 0.7 pp due to product line pruning). Higher net pricing was
due to commodity cost-driven pricing primarily related to lunch combinations and hot dogs. Unfavorable volume/
mix was due primarily to product line pruning and lower shipments in hot dogs, partially offset by favorable mix in
cold cuts.
Segment operating income increased 18.8%, driven primarily by lower manufacturing costs driven by net
productivity and lower overhead costs, partially offset by costs incurred for the Restructuring Program.