Kraft 2013 Annual Report Download - page 56
Download and view the complete annual report
Please find page 56 of the 2013 Kraft annual report below. You can navigate through the pages in the report by either clicking on the pages listed below, or by using the keyword search tool below to find specific information within the annual report.-
 1
1 -
2
-
3
-
4
-
5
-
6
-
7
-
8
-
9
-
10
-
11
-
12
-
13
-
14
-
15
-
16
-
17
-
18
-
19
-
20
-
21
-
22
-
23
-
24
-
25
-
26
-
27
-
28
-
29
-
30
-
31
-
32
-
33
-
34
-
35
-
36
-
37
-
38
-
39
-
40
-
41
-
42
-
43
-
44
-
45
-
 46
46 -
 47
47 -
 48
48 -
 49
49 -
 50
50 -
 51
51 -
 52
52 -
 53
53 -
 54
54 -
 55
55 -
 56
56 -
 57
57 -
 58
58 -
 59
59 -
 60
60 -
 61
61 -
 62
62 -
 63
63 -
 64
64 -
 65
65 -
 66
66 -
67
-
68
-
69
-
70
-
71
-
72
-
73
-
74
-
75
-
76
-
77
-
78
-
79
-
80
-
81
-
82
-
83
-
84
-
85
-
86
-
87
-
88
-
89
-
90
-
91
-
92
 |
 |
54
As of December 28, 2013, we have incurred Restructuring Program costs of $585 million since the inception of the
Restructuring Program. We have spent $261 million in cash. We expect to complete the Restructuring Program by
the end of 2014.
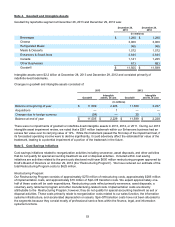
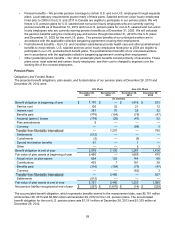
We recorded Restructuring Program costs and spending in the consolidated financial statements as follows:
For the Years Ended
December 28,
2013 December 29,
2012
Restructuring costs - Asset impairment and exit costs $ 108 $ 141
Implementation costs - Cost of sales 77 97
Implementation costs - Selling, general and administrative expenses 65 34
Spin-Off transition costs - Selling, general and administrative expenses 32 31
$ 282 $ 303
We incurred non-cash costs of $157 million in the year ended December 28, 2013 and $151 million in the year
ended December 28, 2012. We spent cash of $150 million in the year ended December 28, 2013 and $111 million
in the year ended December 29, 2012 related to our Restructuring Program.
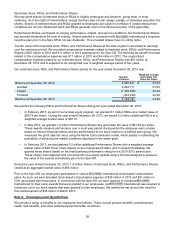
Restructuring Program Costs by Segment:
During the years ended December 28, 2013 and December 29, 2012, we recorded Restructuring Program costs
within segment operating income as follows:
For the Year Ended December 28, 2013 For the Year Ended December 29, 2012
Restructuring
Costs Implementation
Costs
Spin-Off
Transition
Costs Total Restructuring
Costs Implementation
Costs
Spin-Off
Transition
Costs Total
(in millions)
Beverages $ 19 $ 22 $ — $ 41 $ 44 $ 19 $ — $ 63
Cheese 26 62 — 88 26 72 — 98
Refrigerated Meals 18 17 — 35 19 11 — 30
Meals & Desserts 14 12 — 26 15 9 — 24
Enhancers & Snack Nuts 12 12 — 24 17 8 — 25
Canada 10 7 — 17 9 5 — 14
Other Businesses 9 10 — 19 11 7 — 18
Corporate expenses — — 32 32 — — 31 31
Total $ 108 $ 142 $ 32 $ 282 $ 141 $ 131 $ 31 $ 303
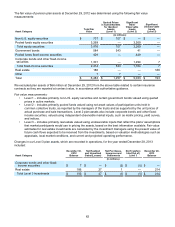
Restructuring Costs Liability:
At December 28, 2013, the restructuring costs liability balance within other current liabilities was as follows:
Severance
and Related
Costs Asset
Write-downs Total
(in millions)
Liability balance, December 30, 2012 $ 44 $ — $ 44
Restructuring costs 80 28 108
Cash spent on restructuring costs (61) — (61)
Non-cash items (44) (28) (72)
Liability balance, December 28, 2013 $ 19 $ — $ 19
Other Cost Savings Initiatives:
We recorded approximately $8 million of corporate expenses in selling, general and administrative expenses
related to our other cost savings initiatives during the year ended December 28, 2013.