Kraft 2013 Annual Report Download - page 69
Download and view the complete annual report
Please find page 69 of the 2013 Kraft annual report below. You can navigate through the pages in the report by either clicking on the pages listed below, or by using the keyword search tool below to find specific information within the annual report.-
 1
1 -
2
-
3
-
4
-
5
-
6
-
7
-
8
-
9
-
10
-
11
-
12
-
13
-
14
-
15
-
16
-
17
-
18
-
19
-
20
-
21
-
22
-
23
-
24
-
25
-
26
-
27
-
28
-
29
-
30
-
31
-
32
-
33
-
34
-
35
-
36
-
37
-
38
-
39
-
40
-
41
-
42
-
43
-
44
-
45
-
46
-
47
-
48
-
49
-
50
-
51
-
52
-
53
-
54
-
55
-
56
-
57
-
58
-
 59
59 -
 60
60 -
 61
61 -
 62
62 -
 63
63 -
 64
64 -
 65
65 -
 66
66 -
 67
67 -
 68
68 -
 69
69 -
 70
70 -
 71
71 -
 72
72 -
 73
73 -
 74
74 -
 75
75 -
 76
76 -
 77
77 -
 78
78 -
 79
79 -
80
-
81
-
82
-
83
-
84
-
85
-
86
-
87
-
88
-
89
-
90
-
91
-
92
 |
 |
67
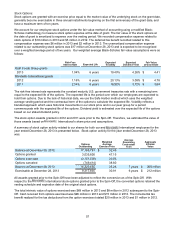
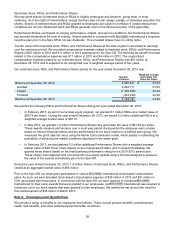
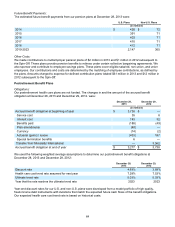
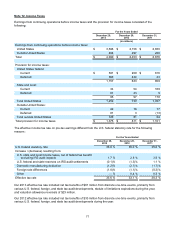
obligations previously provided by International. Accordingly, International transferred to us the
plan assets and liabilities associated with our active, retired, and other former employees, including liabilities for
most of the retired North American International employees. We assumed net benefit plan liabilities of
$5.5 billion from International, which was in addition to the $0.1 billion of net benefit plan liabilities we had
previously reported in our historical financial statements, for a total liability of $5.6 billion on October 1, 2012.
Total International benefit plan costs allocated to us were $491 million in the first nine months of 2012
prior to the Spin-Off and $497 million in 2011. The expense allocations for these benefits were determined based on
a review of personnel by business unit and based on allocations of corporate or other shared functional personnel.
These allocated costs are reflected in our cost of sales and selling, general and administrative expenses. These
costs were funded through intercompany transactions with International and were reflected within the
parent company investment equity balance. Our allocated expenses in connection with the pension plans were
$283 million in 2012 and $261 million in 2011. Our allocated expenses in connection with the postretirement plans
were $142 million in 2012 and $160 million in 2011.
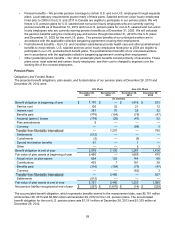
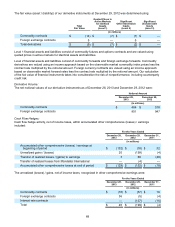
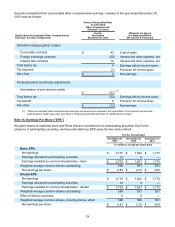
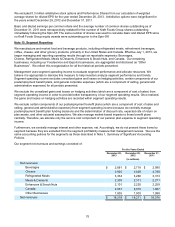
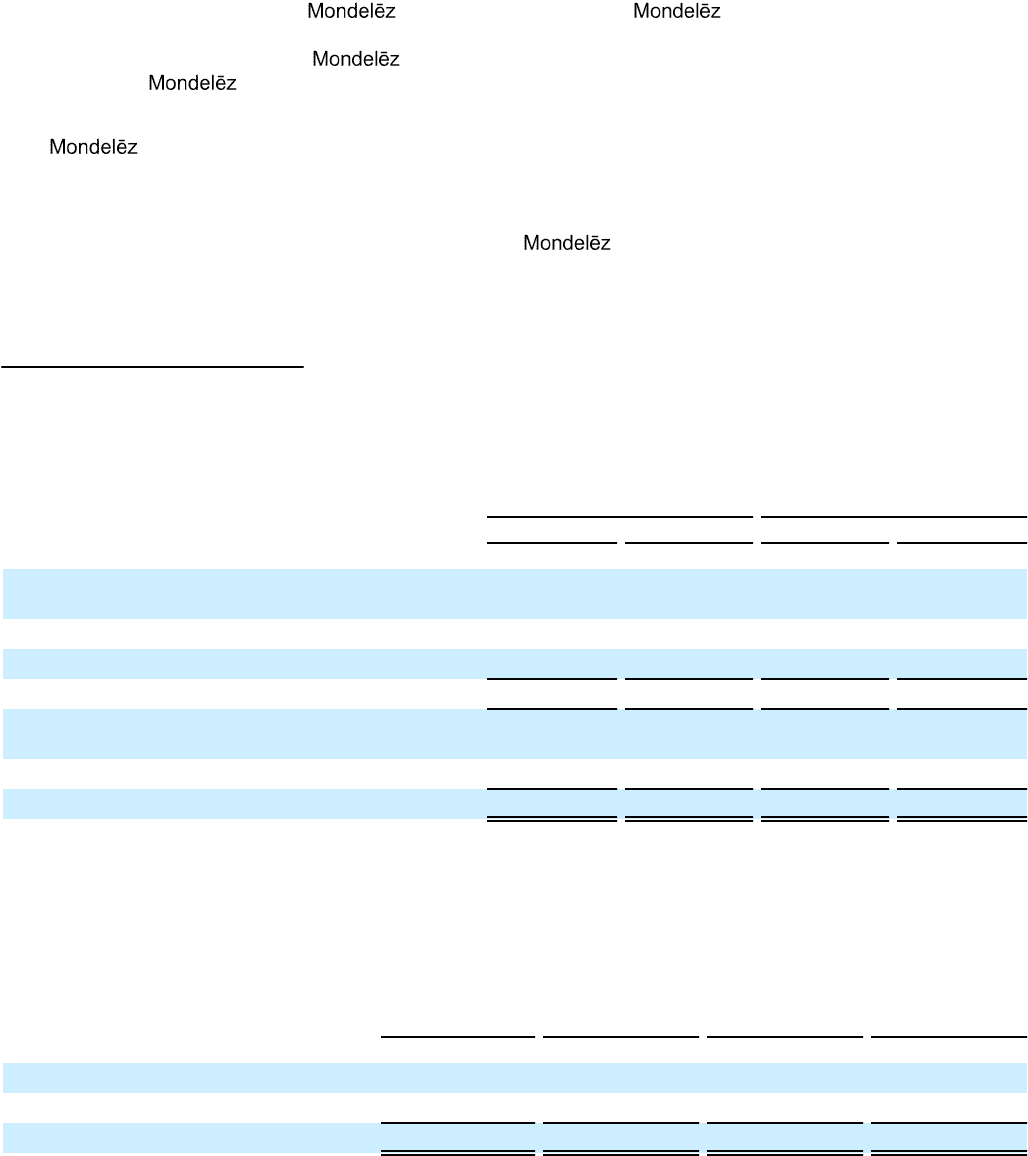
Note 10. Financial Instruments
Fair Value of Derivative Instruments:
The fair values of derivative instruments recorded in the consolidated balance sheets as of December 28, 2013 and
December 29, 2012 were:
December 28,
2013 December 29,
2012
Assets Liabilities Assets Liabilities
(in millions)
Derivatives designated as hedging
instruments:
Commodity contracts $5$ 4 $ 7 $ 11
Foreign exchange contracts 48 — 8 3
$ 53 $ 4 $ 15 $ 14
Derivatives not designated as hedging
instruments:
Commodity contracts $ 40 $ 21 $ 24 $ 34
Total fair value $ 93 $ 25 $ 39 $ 48
The fair value of our asset derivatives is recorded within other current assets and other assets. The fair value of our
liability derivatives is recorded within other current liabilities.
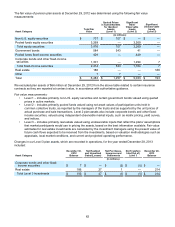
The fair value (asset / (liability)) of our derivative instruments at December 28, 2013 was determined using:
Total
Fair Value
Quoted Prices in
Active Markets
for Identical
Assets
(Level 1)
Significant
Other Observable
Inputs
(Level 2)
Significant
Unobservable
Inputs
(Level 3)
(in millions)
Commodity contracts $ 20 $ 20 $ — $ —
Foreign exchange contracts 48 — 48 —
Total derivatives $ 68 $ 20 $ 48 $ —