Kraft 2013 Annual Report Download - page 45
Download and view the complete annual report
Please find page 45 of the 2013 Kraft annual report below. You can navigate through the pages in the report by either clicking on the pages listed below, or by using the keyword search tool below to find specific information within the annual report.-
 1
1 -
2
-
3
-
4
-
5
-
6
-
7
-
8
-
9
-
10
-
11
-
12
-
13
-
14
-
15
-
16
-
17
-
18
-
19
-
20
-
21
-
22
-
23
-
24
-
25
-
26
-
27
-
28
-
29
-
30
-
31
-
32
-
33
-
34
-
 35
35 -
 36
36 -
 37
37 -
 38
38 -
 39
39 -
 40
40 -
 41
41 -
 42
42 -
 43
43 -
 44
44 -
 45
45 -
 46
46 -
 47
47 -
 48
48 -
 49
49 -
 50
50 -
 51
51 -
 52
52 -
 53
53 -
 54
54 -
 55
55 -
56
-
57
-
58
-
59
-
60
-
61
-
62
-
63
-
64
-
65
-
66
-
67
-
68
-
69
-
70
-
71
-
72
-
73
-
74
-
75
-
76
-
77
-
78
-
79
-
80
-
81
-
82
-
83
-
84
-
85
-
86
-
87
-
88
-
89
-
90
-
91
-
92
 |
 |

43
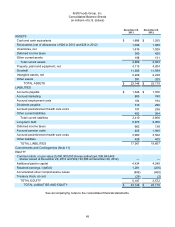
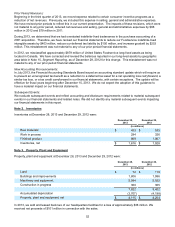
Kraft Foods Group, Inc.
Consolidated Statements of Earnings
(in millions of U.S. dollars, except per share data)
For the Years Ended
December 28,
2013 December 29,
2012 December 31,
2011
Net revenues $ 18,218 $ 18,271 $ 18,576
Cost of sales 11,395 12,499 12,813
Gross profit 6,823 5,772 5,763
Selling, general and administrative expenses 2,124 2,961 2,937
Asset impairment and exit costs 108 141 (2)
Operating income 4,591 2,670 2,828
Interest and other expense, net (501) (258) (7)
— 41 55
Earnings before income taxes 4,090 2,453 2,876
Provision for income taxes 1,375 811 1,101
Net earnings $ 2,715 $ 1,642 $ 1,775
Per share data:
Basic earnings per share $ 4.55 $ 2.77 $ 3.00
Diluted earnings per share $ 4.51 $ 2.75 $ 3.00
Dividends declared $ 2.05 0.50 —
See accompanying notes to the consolidated financial statements.