Kraft 2013 Annual Report Download - page 26
Download and view the complete annual report
Please find page 26 of the 2013 Kraft annual report below. You can navigate through the pages in the report by either clicking on the pages listed below, or by using the keyword search tool below to find specific information within the annual report.-
 1
1 -
2
-
3
-
4
-
5
-
6
-
7
-
8
-
9
-
10
-
11
-
12
-
13
-
14
-
15
-
 16
16 -
 17
17 -
 18
18 -
 19
19 -
 20
20 -
 21
21 -
 22
22 -
 23
23 -
 24
24 -
 25
25 -
 26
26 -
 27
27 -
 28
28 -
 29
29 -
 30
30 -
 31
31 -
 32
32 -
 33
33 -
 34
34 -
 35
35 -
 36
36 -
37
-
38
-
39
-
40
-
41
-
42
-
43
-
44
-
45
-
46
-
47
-
48
-
49
-
50
-
51
-
52
-
53
-
54
-
55
-
56
-
57
-
58
-
59
-
60
-
61
-
62
-
63
-
64
-
65
-
66
-
67
-
68
-
69
-
70
-
71
-
72
-
73
-
74
-
75
-
76
-
77
-
78
-
79
-
80
-
81
-
82
-
83
-
84
-
85
-
86
-
87
-
88
-
89
-
90
-
91
-
92
 |
 |
24
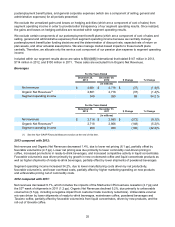
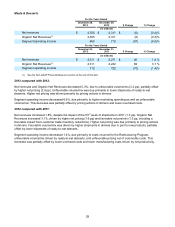
2012 compared with 2011:
In addition to the items impacting operating income, the decrease in Diluted EPS in 2012 compared to 2011 was
driven by the increase in interest and other expense, net. The increase in interest and other expense, net was due
to the $6.0 billion debt issuance in June 2012, the $3.6 billion debt exchange in July 2012, and the $0.4 billion
transfer of debt from International in October 2012. As a result, we incurred a partial year of interest and
other expense, net in 2012 related to these debt instruments compared to none in 2011.
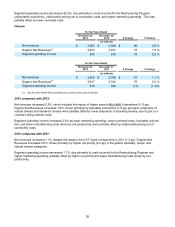
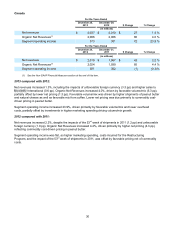
Results of Operations by Reportable Segment
Effective July 1, 2013, we began managing and reporting operating results through six reportable segments:
Beverages, Cheese, Refrigerated Meals, Meals & Desserts, Enhancers & Snack Nuts, and Canada. Our remaining
businesses, including our Foodservice and Exports businesses, are aggregated and disclosed as “Other
Businesses”. We reflect this reorganization for all the historical periods presented.
The following discussion compares our results of operations for each of our reportable segments for 2013 with 2012
and 2012 with 2011.
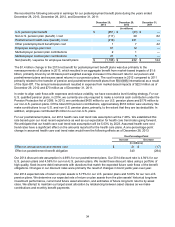
For the Years Ended
December 28,
2013 December 29,
2012 December 31,
2011
(in millions)
Net revenues:
Beverages $ 2,681 $ 2,718 $ 2,990
Cheese 3,925 3,829 3,788
Refrigerated Meals 3,334 3,280 3,313
Meals & Desserts 2,305 2,311 2,271
Enhancers & Snack Nuts 2,101 2,220 2,259
Canada 2,037 2,010 1,967
Other Businesses 1,835 1,903 1,988
Net revenues $ 18,218 $ 18,271 $ 18,576
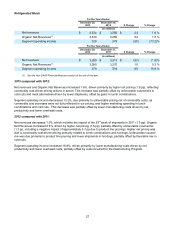
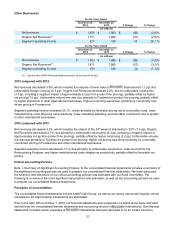
For the Years Ended
December 28,
2013 December 29,
2012 December 31,
2011
(in millions)
Earnings before income taxes:
Operating income:
Beverages $ 349 $ 260 $ 450
Cheese 634 618 629
Refrigerated Meals 329 379 319
Meals & Desserts 665 712 722
Enhancers & Snack Nuts 529 592 594
Canada 373 301 302
Other Businesses 227 180 182
Unrealized gains / (losses) on hedging activities 21 13 (64)
Certain postemployment benefit plan income / (costs) 1,622 (305) (240)
General corporate expenses (158) (80) (66)
Operating income $ 4,591 $ 2,670 $ 2,828
Management uses segment operating income to evaluate segment performance and allocate resources. We
believe it is appropriate to disclose this measure to help investors analyze segment performance and trends.
Segment operating income excludes unrealized gains and losses on hedging activities, certain components of our