Kraft 2013 Annual Report Download - page 23
Download and view the complete annual report
Please find page 23 of the 2013 Kraft annual report below. You can navigate through the pages in the report by either clicking on the pages listed below, or by using the keyword search tool below to find specific information within the annual report.-
 1
1 -
2
-
3
-
4
-
5
-
6
-
7
-
8
-
9
-
10
-
11
-
12
-
 13
13 -
 14
14 -
 15
15 -
 16
16 -
 17
17 -
 18
18 -
 19
19 -
 20
20 -
 21
21 -
 22
22 -
 23
23 -
 24
24 -
 25
25 -
 26
26 -
 27
27 -
 28
28 -
 29
29 -
 30
30 -
 31
31 -
 32
32 -
 33
33 -
34
-
35
-
36
-
37
-
38
-
39
-
40
-
41
-
42
-
43
-
44
-
45
-
46
-
47
-
48
-
49
-
50
-
51
-
52
-
53
-
54
-
55
-
56
-
57
-
58
-
59
-
60
-
61
-
62
-
63
-
64
-
65
-
66
-
67
-
68
-
69
-
70
-
71
-
72
-
73
-
74
-
75
-
76
-
77
-
78
-
79
-
80
-
81
-
82
-
83
-
84
-
85
-
86
-
87
-
88
-
89
-
90
-
91
-
92
 |
 |
21
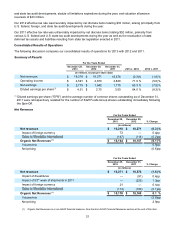
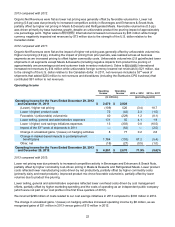
and state tax audit developments, statute of limitations expirations during the year, and valuation allowance
reversals of $23 million.
Our 2012 effective tax rate was favorably impacted by net discrete items totaling $33 million, arising principally from
U.S. federal, foreign, and state tax audit developments during the year.
Our 2011 effective tax rate was unfavorably impacted by net discrete items totaling $52 million, primarily from
various U.S. federal and U.S. state tax audit developments during the year as well as the revaluation of state
deferred tax assets and liabilities resulting from state tax legislation enacted in 2011.
Consolidated Results of Operations
The following discussion compares our consolidated results of operations for 2013 with 2012 and 2011.
Summary of Results
For the Years Ended
December 28,
2013 December 29,
2012 December 31,
2011 2013 v. 2012 2012 v. 2011
(in millions, except per share data)
Net revenues $18,218 $18,271 18,576 (0.3)% (1.6)%
Operating income $4,591 $2,670 2,828 71.9 % (5.6)%
Net earnings $2,715 $1,642 1,775 65.3 % (7.5)%
Diluted earnings per share(1) $4.51 $ 2.75 3.00 64.0 % (8.3)%
(1) Diluted earnings per share ("EPS") and the average number of common shares outstanding as of December 31,
2011 were retrospectively restated for the number of Kraft Foods Group shares outstanding immediately following
the Spin-Off.
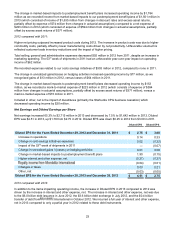
Net Revenues
For the Years Ended
December 28,
2013 December 29,
2012 % Change
(in millions)
Net revenues $ 18,218 $ 18,271 (0.3 )%
Impact of foreign currency 73 — 0.4pp
(147) (114) (0.2)pp
Organic Net Revenues (1) $ 18,144 $ 18,157 (0.1 )%
Volume/mix 0.5pp
Net pricing (0.6)pp
For the Years Ended
December 29,
2012 December 31,
2011 % Change
(in millions)
Net revenues $ 18,271 $ 18,576 (1.6 )%
Impact of divestitures — (91) 0.4pp
Impact of 53rd week of shipments in 2011 — (225) 1.3pp
Impact of foreign currency 21 — 0.1pp
(114) (100) (0.1)pp
Organic Net Revenues (1) $ 18,178 $ 18,160 0.1 %
Volume/mix (2.8)pp
Net pricing 2.9pp
(1) Organic Net Revenues is a non-GAAP financial measure. See the Non-GAAP Financial Measures section at the end of this item.