Kraft 2013 Annual Report Download - page 77
Download and view the complete annual report
Please find page 77 of the 2013 Kraft annual report below. You can navigate through the pages in the report by either clicking on the pages listed below, or by using the keyword search tool below to find specific information within the annual report.-
 1
1 -
2
-
3
-
4
-
5
-
6
-
7
-
8
-
9
-
10
-
11
-
12
-
13
-
14
-
15
-
16
-
17
-
18
-
19
-
20
-
21
-
22
-
23
-
24
-
25
-
26
-
27
-
28
-
29
-
30
-
31
-
32
-
33
-
34
-
35
-
36
-
37
-
38
-
39
-
40
-
41
-
42
-
43
-
44
-
45
-
46
-
47
-
48
-
49
-
50
-
51
-
52
-
53
-
54
-
55
-
56
-
57
-
58
-
59
-
60
-
61
-
62
-
63
-
64
-
65
-
66
-
 67
67 -
 68
68 -
 69
69 -
 70
70 -
 71
71 -
 72
72 -
 73
73 -
 74
74 -
 75
75 -
 76
76 -
 77
77 -
 78
78 -
 79
79 -
 80
80 -
 81
81 -
 82
82 -
 83
83 -
 84
84 -
 85
85 -
 86
86 -
 87
87 -
88
-
89
-
90
-
91
-
92
 |
 |

75
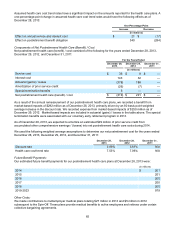
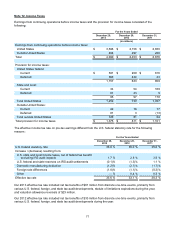
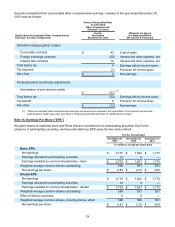
We excluded 0.3 million antidilutive stock options and Performance Shares from our calculation of weighted
average shares for diluted EPS for the year ended December 28, 2013. Antidilutive options were insignificant for
the years ended December 29, 2012 and December 31, 2011.
Basic and diluted earnings per common share and the average number of common shares outstanding as of
December 31, 2011 were retrospectively restated for the number of Kraft Foods Group shares outstanding
immediately following the Spin-Off. The same number of shares was used to calculate basic and diluted EPS since
no Kraft Foods Group equity awards were outstanding prior to the Spin-Off.
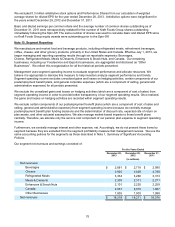
Note 15. Segment Reporting
We manufacture and market food and beverage products, including refrigerated meals, refreshment beverages,
coffee, cheese, and other grocery products, primarily in the United States and Canada. Effective July 1, 2013, we
began managing and reporting operating results through six reportable segments: Beverages,
Cheese, Refrigerated Meals, Meals & Desserts, Enhancers & Snack Nuts, and Canada. Our remaining
businesses, including our Foodservice and Exports businesses, are aggregated and disclosed as “Other
Businesses”. We reflect this reorganization for all the historical periods presented.
Management uses segment operating income to evaluate segment performance and allocate resources. We
believe it is appropriate to disclose this measure to help investors analyze segment performance and trends.
Segment operating income excludes unrealized gains and losses on hedging activities, certain components of our
postemployment benefit plans, and general corporate expenses (which are a component of selling, general and
administrative expenses) for all periods presented.
We exclude the unrealized gains and losses on hedging activities (which are a component of cost of sales) from
segment operating income in order to provide better transparency of our segment operating results. Once realized,
the gains and losses on hedging activities are recorded within segment operating results.
We exclude certain components of our postemployment benefit plans (which are a component of cost of sales and
selling, general and administrative expenses) from segment operating income because we centrally manage
postemployment benefit plan funding decisions and the determination of discount rate, expected rate of return on
plan assets, and other actuarial assumptions. We also manage market-based impacts to these benefit plans
centrally. Therefore, we allocate only the service cost component of our pension plan expense to segment operating
income.
Furthermore, we centrally manage interest and other expense, net. Accordingly, we do not present these items by
segment because they are excluded from the segment profitability measure that management reviews. We use the
same accounting policies for the segments as those described in Note 1, Summary of Significant Accounting
Policies.
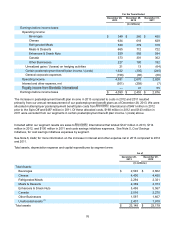
Our segment net revenues and earnings consisted of:
For the Years Ended
December 28,
2013 December 29,
2012 December 31,
2011
(in millions)
Net revenues:
Beverages $ 2,681 $ 2,718 $ 2,990
Cheese 3,925 3,829 3,788
Refrigerated Meals 3,334 3,280 3,313
Meals & Desserts 2,305 2,311 2,271
Enhancers & Snack Nuts 2,101 2,220 2,259
Canada 2,037 2,010 1,967
Other Businesses 1,835 1,903 1,988
Net revenues $ 18,218 $ 18,271 $ 18,576