Kraft 2013 Annual Report Download - page 63
Download and view the complete annual report
Please find page 63 of the 2013 Kraft annual report below. You can navigate through the pages in the report by either clicking on the pages listed below, or by using the keyword search tool below to find specific information within the annual report.-
 1
1 -
2
-
3
-
4
-
5
-
6
-
7
-
8
-
9
-
10
-
11
-
12
-
13
-
14
-
15
-
16
-
17
-
18
-
19
-
20
-
21
-
22
-
23
-
24
-
25
-
26
-
27
-
28
-
29
-
30
-
31
-
32
-
33
-
34
-
35
-
36
-
37
-
38
-
39
-
40
-
41
-
42
-
43
-
44
-
45
-
46
-
47
-
48
-
49
-
50
-
51
-
52
-
 53
53 -
 54
54 -
 55
55 -
 56
56 -
 57
57 -
 58
58 -
 59
59 -
 60
60 -
 61
61 -
 62
62 -
 63
63 -
 64
64 -
 65
65 -
 66
66 -
 67
67 -
 68
68 -
 69
69 -
 70
70 -
 71
71 -
 72
72 -
 73
73 -
74
-
75
-
76
-
77
-
78
-
79
-
80
-
81
-
82
-
83
-
84
-
85
-
86
-
87
-
88
-
89
-
90
-
91
-
92
 |
 |

61
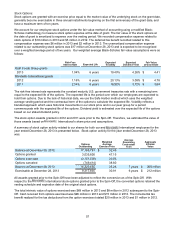
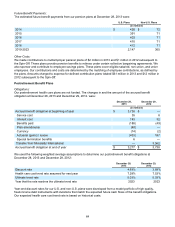
returns. We recorded $707 million of the benefit from market-based impacts in cost of sales and $561 million in
selling, general and administrative expenses. The annual remeasurement resulted in benefit from market-based
impacts of $29 million as of December 29, 2012 and an expense from market-based impacts of $68 million as of
December 31, 2011. Market-based impacts are included in actuarial (gains) / losses and in settlements in the table
above. We disclose market-based impacts separately in order to provide better transparency of our operating
results. We define market-based impacts as the costs or benefits resulting from the change in discount rates, the
difference between our estimated and actual return on trust assets, and other assumption changes driven by
changes in the law or other external factors.
Net pension costs included settlement losses of $69 million in 2013 related to retiring employees who elected lump-
sum payments. Net pension costs also included special termination benefits associated with our voluntary early
retirement program of $62 million in 2013, which were included in our Restructuring Program.
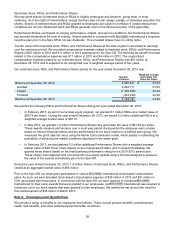
We determine the expected return on plan assets based on asset fair values as of the measurement date.
As of December 28, 2013, we expected to amortize an estimated $5 million of prior service cost from accumulated
other comprehensive earnings / (losses) into net periodic pension cost for the combined U.S. and non-U.S. pension
plans during 2014.
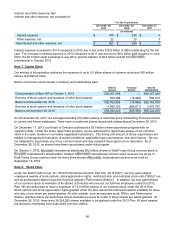
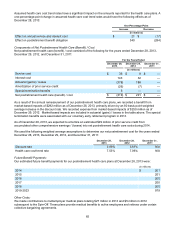
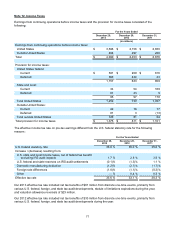
We used the following weighted average assumptions to determine our net pension cost for the years ended
December 28, 2013, December 29, 2012 and December 31, 2011:
U.S. Plans Non-U.S. Plans
December 28,
2013 December 29,
2012 December 31,
2011 December 28,
2013 December 29,
2012 December 31,
2011
Discount rate 4.34% 3.85% N/A 4.00% 4.03% 5.00%
Expected rate of return on
plan assets 5.75% 8.00% N/A 5.00% 7.04% 7.36%
Rate of compensation
increase 4.00% 4.00% N/A 3.00% 3.00% 3.00%
Year-end discount rates for our U.S. and non-U.S. plans were developed from a model portfolio of high quality,
fixed-income debt instruments with durations that match the expected future cash flows of the benefit obligations.
We determine our expected rate of return on plan assets from the plan assets’ historical long-term investment
performance, current and future asset allocation, and estimates of future long-term returns by asset class.
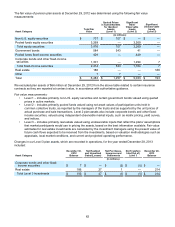
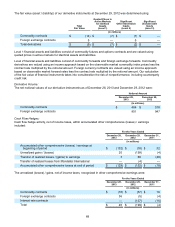
Plan Assets:
The fair value of pension plan assets at December 28, 2013 was determined using the following fair value
measurements:
Asset Category Total Fair Value
Quoted Prices
in Active Markets
for Identical
Assets
(Level 1)
Significant
Other
Observable
Inputs
(Level 2)
Significant
Unobservable
Inputs
(Level 3)
(in millions)
Non-U.S. equity securities $ 645 $ 645 $ — $ —
Pooled funds equity securities 3,123 6 3,117 —
Total equity securities 3,768 651 3,117 —
Government bonds 719 621 98 —
Pooled funds fixed-income securities 642 — 642 —
Corporate bonds and other fixed-income
securities 1,566 1 1,565 —
Total fixed-income securities 2,927 622 2,305 —
Real estate 214 — — 214
Other 88 — —
Total $ 6,917 $ 1,281 $ 5,422 $ 214
We excluded plan assets of $57 million at December 28, 2013 from the above table related to certain insurance
contracts as they are reported at contract value, in accordance with authoritative guidance.