Kraft 2013 Annual Report Download - page 78
Download and view the complete annual report
Please find page 78 of the 2013 Kraft annual report below. You can navigate through the pages in the report by either clicking on the pages listed below, or by using the keyword search tool below to find specific information within the annual report.-
 1
1 -
2
-
3
-
4
-
5
-
6
-
7
-
8
-
9
-
10
-
11
-
12
-
13
-
14
-
15
-
16
-
17
-
18
-
19
-
20
-
21
-
22
-
23
-
24
-
25
-
26
-
27
-
28
-
29
-
30
-
31
-
32
-
33
-
34
-
35
-
36
-
37
-
38
-
39
-
40
-
41
-
42
-
43
-
44
-
45
-
46
-
47
-
48
-
49
-
50
-
51
-
52
-
53
-
54
-
55
-
56
-
57
-
58
-
59
-
60
-
61
-
62
-
63
-
64
-
65
-
66
-
67
-
 68
68 -
 69
69 -
 70
70 -
 71
71 -
 72
72 -
 73
73 -
 74
74 -
 75
75 -
 76
76 -
 77
77 -
 78
78 -
 79
79 -
 80
80 -
 81
81 -
 82
82 -
 83
83 -
 84
84 -
 85
85 -
 86
86 -
 87
87 -
 88
88 -
89
-
90
-
91
-
92
 |
 |
76
For the Years Ended
December 28,
2013 December 29,
2012 December 31,
2011
(in millions)
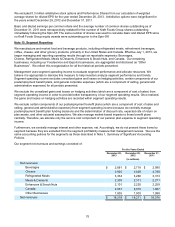
Earnings before income taxes:
Operating income:
Beverages $ 349 $ 260 $ 450
Cheese 634 618 629
Refrigerated Meals 329 379 319
Meals & Desserts 665 712 722
Enhancers & Snack Nuts 529 592 594
Canada 373 301 302
Other Businesses 227 180 182
Unrealized gains / (losses) on hedging activities 21 13 (64)
Certain postemployment benefit plan income / (costs) 1,622 (305) (240)
General corporate expenses (158) (80) (66)
Operating income 4,591 2,670 2,828
Interest and other expense, net (501) (258) (7)
— 41 55
Earnings before income taxes $ 4,090 $ 2,453 $ 2,876
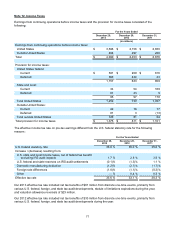
The increase in postemployment benefit plan income in 2013 compared to costs in 2012 and 2011 resulted
primarily from our annual remeasurement of our postemployment benefit plans as of December 28, 2013. We were
allocated multiemployer postemployment benefit plan costs from International of $491 million in 2012
prior to the Spin-Off and $497 million in 2011. Of these allocated costs, $168 million in 2012 and $143 million in
2011 were excluded from our segments in certain postemployment benefit plan income / (costs) above.
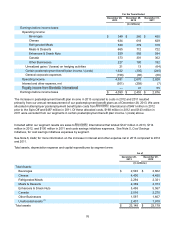
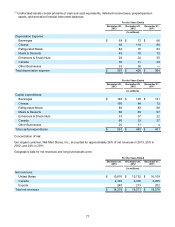
Included within our segment results are sales to International that totaled $147 million in 2013, $114
million in 2012, and $100 million in 2011 and costs savings initiatives expenses. See Note 5, Cost Savings
Initiatives, for cost savings initiatives expenses by segment.
See Note 6, Debt, for more information on the increase in interest and other expense net in 2013 compared to 2012
and 2011.
Total assets, depreciation expense and capital expenditures by segment were:
As of
December 28,
2013 December 29,
2012
(in millions)
Total Assets:
Beverages $ 2,593 $ 2,662
Cheese 4,400 4,455
Refrigerated Meals 2,294 2,321
Meals & Desserts 2,389 2,373
Enhancers & Snack Nuts 5,458 5,567
Canada 2,016 2,275
Other Businesses 1,597 1,607
Unallocated assets (1) 2,401 1,919
Total assets $ 23,148 $ 23,179