Kraft 2013 Annual Report Download - page 38
Download and view the complete annual report
Please find page 38 of the 2013 Kraft annual report below. You can navigate through the pages in the report by either clicking on the pages listed below, or by using the keyword search tool below to find specific information within the annual report.-
 1
1 -
2
-
3
-
4
-
5
-
6
-
7
-
8
-
9
-
10
-
11
-
12
-
13
-
14
-
15
-
16
-
17
-
18
-
19
-
20
-
21
-
22
-
23
-
24
-
25
-
26
-
27
-
 28
28 -
 29
29 -
 30
30 -
 31
31 -
 32
32 -
 33
33 -
 34
34 -
 35
35 -
 36
36 -
 37
37 -
 38
38 -
 39
39 -
 40
40 -
 41
41 -
 42
42 -
 43
43 -
 44
44 -
 45
45 -
 46
46 -
 47
47 -
 48
48 -
49
-
50
-
51
-
52
-
53
-
54
-
55
-
56
-
57
-
58
-
59
-
60
-
61
-
62
-
63
-
64
-
65
-
66
-
67
-
68
-
69
-
70
-
71
-
72
-
73
-
74
-
75
-
76
-
77
-
78
-
79
-
80
-
81
-
82
-
83
-
84
-
85
-
86
-
87
-
88
-
89
-
90
-
91
-
92
 |
 |

36
Contingencies
See Note 11, Commitments and Contingencies, to the consolidated financial statements for a discussion of
contingencies.
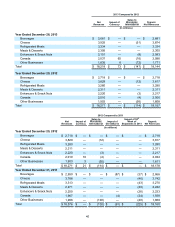
Commodity Trends
We purchase large quantities of commodities, including dairy products, coffee beans, meat products, wheat, corn
products, soybean and vegetable oils, nuts, and sugar and other sweeteners. In addition, we use significant
quantities of resins and cardboard to package our products and natural gas to operate our facilities. We
continuously monitor worldwide supply and cost trends of these commodities.
During 2013, our aggregate commodity costs increased over the prior year period, primarily as a result of higher
costs of dairy, meat products, packaging materials and flour and grain costs, partially offset by lower coffee, nuts,
sugar and soy bean and vegetable oil costs. Our commodity costs increased approximately $119 million in 2013
and $248 million in 2012 compared to the prior year.
Despite higher commodity costs, our total product costs decreased in 2013 compared to the comparable prior year
period driven by net productivity.
Liquidity and Capital Resources
We believe that cash generated from our operating activities, our $3.0 billion revolving credit facility, and our
commercial paper program will provide sufficient liquidity to meet our working capital needs, expected cost savings
initiatives expenditures, planned capital expenditures, planned contributions to our postemployment benefit plans,
future contractual obligations, and payment of our anticipated quarterly dividends. We will use our cash on hand
and our commercial paper program for daily funding requirements. Overall, we do not expect any negative effects
on our funding sources that would have a material effect on our short-term or long-term liquidity.
Net Cash Provided by Operating Activities:
Operating activities provided net cash of $2.0 billion in 2013, $3.0 billion in 2012, and $2.7 billion in 2011. The
decrease in cash provided by operating cash flows in 2013 primarily related to a $569 million increase in pension
contributions, a $139 million increase in postretirement health care payments and higher cash paid for taxes and
interest. The increase in operating cash flows in 2012 was primarily related to earnings, partially offset by higher
interest payments on our long-term debt.
Net Cash Used in Investing Activities:
Net cash used in investing activities was $426 million in 2013, $422 million in 2012, and $401 million in 2011. An
increase in capital expenditures in 2013 was offset by an increase in proceeds from the sale of property, plant and
equipment. The increase in cash used in investing activities in 2012 primarily related to increased capital
expenditures partially offset by proceeds from the sale of property, plant and equipment.
Capital expenditures were $557 million in 2013, $440 million in 2012, and $401 million in 2011. The increase in
capital expenditures includes those required for our cost savings initiatives and additional investments in our
business to modernize manufacturing facilities and support new product and productivity initiatives. We expect 2014
capital expenditures to be approximately $560 million, including capital expenditures required for our cost savings
initiatives. We expect to fund these expenditures with cash from operations.
Net Cash Used in Financing Activities:
Net cash used in financing activities was $1.2 billion in 2013, $1.4 billion in 2012, and $2.3 billion in 2011. We paid
dividends of $1.2 billion in 2013. The net cash used in 2012 primarily related to $7.2 billion of net transfers to
International partially offset by the net proceeds we received from our $6.0 billion debt issuance. The net
cash used in financing activities in 2011 primarily related to net transfers to International.
Borrowing Arrangements:
On May 18, 2012, we entered into a $3.0 billion five-year senior unsecured revolving credit facility that expires on
May 17, 2017. All committed borrowings under the facility bear interest at a variable annual rate based on the
London Inter-Bank Offered Rate or a defined base rate, at our election, plus an applicable margin based on the