Kraft 2013 Annual Report Download - page 19
Download and view the complete annual report
Please find page 19 of the 2013 Kraft annual report below. You can navigate through the pages in the report by either clicking on the pages listed below, or by using the keyword search tool below to find specific information within the annual report.-
 1
1 -
2
-
3
-
4
-
5
-
6
-
7
-
8
-
 9
9 -
 10
10 -
 11
11 -
 12
12 -
 13
13 -
 14
14 -
 15
15 -
 16
16 -
 17
17 -
 18
18 -
 19
19 -
 20
20 -
 21
21 -
 22
22 -
 23
23 -
 24
24 -
 25
25 -
 26
26 -
 27
27 -
 28
28 -
 29
29 -
30
-
31
-
32
-
33
-
34
-
35
-
36
-
37
-
38
-
39
-
40
-
41
-
42
-
43
-
44
-
45
-
46
-
47
-
48
-
49
-
50
-
51
-
52
-
53
-
54
-
55
-
56
-
57
-
58
-
59
-
60
-
61
-
62
-
63
-
64
-
65
-
66
-
67
-
68
-
69
-
70
-
71
-
72
-
73
-
74
-
75
-
76
-
77
-
78
-
79
-
80
-
81
-
82
-
83
-
84
-
85
-
86
-
87
-
88
-
89
-
90
-
91
-
92
 |
 |
17
While we cannot predict with certainty the results of Legal Matters in which we are currently involved or may in the
future be involved, we do not expect that the ultimate costs to resolve any of the Legal Matters that are currently
pending will have a material adverse effect on our financial condition or results of operations.
Item 4. Mine Safety Disclosures.
Not applicable.
PART II
Item 5. Market for Registrant’s Common Equity, Related Stockholder Matters and Issuer Purchases of
Equity Securities.
Our common stock is listed on the NASDAQ Global Select Market (“NASDAQ”). At January 25, 2014, there were
approximately 69,318 holders of record of our common stock.
Information regarding our common stock high and low sales prices as reported on NASDAQ and dividends declared
is included in Note 16, Quarterly Financial Data (Unaudited), to the consolidated financial statements.
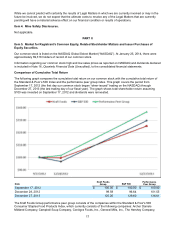
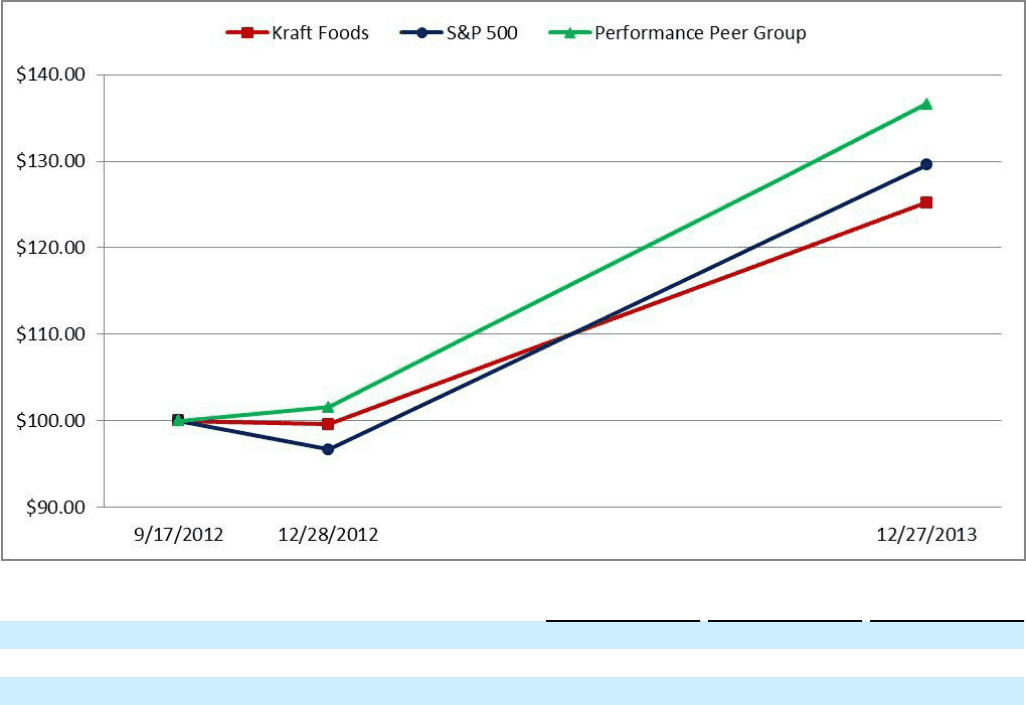
Comparison of Cumulative Total Return
The following graph compares the cumulative total return on our common stock with the cumulative total return of
the Standard & Poor’s 500 Index and the performance peer group index. This graph covers the period from
September 17, 2012 (the first day our common stock began “when-issued” trading on the NASDAQ) through
December 27, 2013 (the last trading day of our fiscal year). The graph shows total shareholder return assuming
$100 was invested on September 17, 2012 and dividends were reinvested.
Date Kraft Foods
Group S&P 500 Performance
Peer Group
September 17, 2012 $ 100.00 $ 100.00 $ 100.00
December 28, 2012 99.59 96.64 101.55
December 27, 2013 125.20 129.60 136.61
The Kraft Foods Group performance peer group consists of the companies within the Standard & Poor's 500
Consumer Staples Food Products Index, which currently consists of the following companies: Archer Daniels
Midland Company, Campbell Soup Company, ConAgra Foods, Inc., General Mills, Inc., The Hershey Company,