Kraft 2013 Annual Report Download - page 73
Download and view the complete annual report
Please find page 73 of the 2013 Kraft annual report below. You can navigate through the pages in the report by either clicking on the pages listed below, or by using the keyword search tool below to find specific information within the annual report.-
 1
1 -
2
-
3
-
4
-
5
-
6
-
7
-
8
-
9
-
10
-
11
-
12
-
13
-
14
-
15
-
16
-
17
-
18
-
19
-
20
-
21
-
22
-
23
-
24
-
25
-
26
-
27
-
28
-
29
-
30
-
31
-
32
-
33
-
34
-
35
-
36
-
37
-
38
-
39
-
40
-
41
-
42
-
43
-
44
-
45
-
46
-
47
-
48
-
49
-
50
-
51
-
52
-
53
-
54
-
55
-
56
-
57
-
58
-
59
-
60
-
61
-
62
-
 63
63 -
 64
64 -
 65
65 -
 66
66 -
 67
67 -
 68
68 -
 69
69 -
 70
70 -
 71
71 -
 72
72 -
 73
73 -
 74
74 -
 75
75 -
 76
76 -
 77
77 -
 78
78 -
 79
79 -
 80
80 -
 81
81 -
 82
82 -
 83
83 -
84
-
85
-
86
-
87
-
88
-
89
-
90
-
91
-
92
 |
 |

71
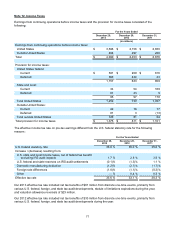
Note 12. Income Taxes
Earnings from continuing operations before income taxes and the provision for income taxes consisted of the
following:
For the Years Ended
December 28,
2013 December 29,
2012 December 31,
2011
(in millions)
Earnings from continuing operations before income taxes:
United States $ 3,596 $ 2,156 $ 2,650
Outside United States 494 297 226
Total $ 4,090 $ 2,453 $ 2,876
Provision for income taxes:
United States federal:
Current $ 591 $ 209 $ 816
Deferred 566 424 43
1,157 633 859
State and local:
Current 34 54 169
Deferred 61 43 9
95 97 178
Total United States 1,252 730 1,037
Outside United States:
Current 42 78 77
Deferred 81 3 (13)
Total outside United States 123 81 64
Total provision for income taxes $ 1,375 $ 811 $ 1,101
The effective income tax rate on pre-tax earnings differed from the U.S. federal statutory rate for the following
reasons :
For the Years Ended
December 28,
2013 December 29,
2012 December 31,
2011
U.S. federal statutory rate 35.0 % 35.0 % 35.0 %
Increase / (decrease) resulting from:
U.S. state and local income taxes, net of federal tax benefit
excluding IRS audit impacts 1.7 % 2.8 % 3.9 %
U.S. federal and state reserves on IRS audit settlements (0.1)% (1.3)% 1.1 %
Domestic manufacturing deduction (1.2)% (2.7)% (1.7)%
Foreign rate differences (1.8)% (1.1)% (0.3)%
Other — % 0.4 % 0.3 %
Effective tax rate 33.6 % 33.1 % 38.3 %
Our 2013 effective tax rate included net tax benefits of $61 million from discrete one-time events, primarily from
various U.S. federal, foreign, and state tax audit developments, statute of limitations expirations during the year,
and valuation allowance reversals of $23 million.
Our 2012 effective tax rate included net tax benefits of $33 million from discrete one-time events, primarily from
various U.S. federal, foreign, and state tax audit developments during the year.