Kraft 2013 Annual Report Download - page 36
Download and view the complete annual report
Please find page 36 of the 2013 Kraft annual report below. You can navigate through the pages in the report by either clicking on the pages listed below, or by using the keyword search tool below to find specific information within the annual report.-
 1
1 -
2
-
3
-
4
-
5
-
6
-
7
-
8
-
9
-
10
-
11
-
12
-
13
-
14
-
15
-
16
-
17
-
18
-
19
-
20
-
21
-
22
-
23
-
24
-
25
-
 26
26 -
 27
27 -
 28
28 -
 29
29 -
 30
30 -
 31
31 -
 32
32 -
 33
33 -
 34
34 -
 35
35 -
 36
36 -
 37
37 -
 38
38 -
 39
39 -
 40
40 -
 41
41 -
 42
42 -
 43
43 -
 44
44 -
 45
45 -
 46
46 -
47
-
48
-
49
-
50
-
51
-
52
-
53
-
54
-
55
-
56
-
57
-
58
-
59
-
60
-
61
-
62
-
63
-
64
-
65
-
66
-
67
-
68
-
69
-
70
-
71
-
72
-
73
-
74
-
75
-
76
-
77
-
78
-
79
-
80
-
81
-
82
-
83
-
84
-
85
-
86
-
87
-
88
-
89
-
90
-
91
-
92
 |
 |

34
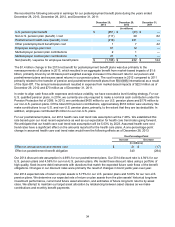
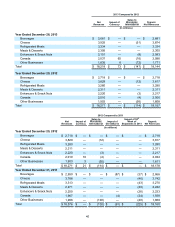
We recorded the following amounts in earnings for our postemployment benefit plans during the years ended
December 28, 2013, December 29, 2012, and December 31, 2011:
December 28,
2013 December 29,
2012 December 31,
2011
(in millions)
U.S. pension plan benefit $ (951) $ (43) $ —
Non-U.S. pension plan (benefit) / cost (117) 29 82
Postretirement health care (benefit) / cost (219) 221 —
Other postemployment benefit plan cost 1 7 42
Employee savings plan cost 61 12 —
Multiemployer pension plan contributions 2 1 —
Multiemployer medical plan contributions 27 5 —
Net (benefit) / expense for employee benefit plans $ (1,196) $ 232 $ 124
The $1.4 billion change in the 2013 net benefit for postemployment benefit plans was due primarily to the
remeasurements of all plans in 2013, which resulted in an aggregate benefit from market-based impacts of $1.6
billion, primarily driven by an 80 basis point weighted average increase in the discount rate for our pension and
postretirement plans and excess asset returns in our pension plans. The cost increase in 2012 compared to 2011
primarily related to the transfer of pension and postretirement benefit plans from International as a result
of the Spin-Off. The annual remeasurement resulted in expense from market-based impacts of $223 million as of
December 29, 2012 and $70 million as of December 31, 2011.
In order to align cash flows with expenses and reduce volatility, we have executed a level funding strategy. For our
U.S. qualified pension plans, in 2014, we currently are only required to make a nominal cash contribution under the
Pension Protection Act of 2006. In 2013, we contributed $435 million to our U.S. pension plans and $176 million to
our non-U.S. pension plans. Of the total 2013 pension contributions, approximately $518 million was voluntary. We
make contributions to our U.S. and non-U.S. pension plans, primarily, to the extent that they are tax deductible. In
addition, employees contributed $5 million to our non-U.S. plans.
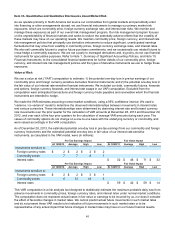
For our postretirement plans, our 2014 health care cost trend rate assumption will be 7.28%. We established this
rate based upon our most recent experience as well as our expectation for health care trend rates going forward.
We anticipate that our health care cost trend rate assumption will be 5.03% by 2023. Assumed health care cost
trend rates have a significant effect on the amounts reported for the health care plans. A one-percentage-point
change in assumed health care cost trend rates would have the following effects as of December 28, 2013:
One-Percentage-Point
Increase Decrease
(in millions)
Effect on annual service and interest cost $ 21 $ (17)
Effect on postretirement benefit obligation 340 (284)
Our 2014 discount rate assumption is 4.69% for our postretirement plans. Our 2014 discount rate is 4.94% for our
U.S. pension plans and 4.56% for our non-U.S. pension plans. We model these discount rates using a portfolio of
high quality, fixed-income debt instruments with durations that match the expected future cash flows of the benefit
obligations. Changes in our discount rates were primarily the result of changes in bond yields year-over-year.
Our 2014 expected rate of return on plan assets is 5.75% for our U.S. pension plans and 5.00% for our non-U.S.
pension plans. We determine our expected rate of return on plan assets from the plan assets’ historical long-term
investment performance, current and future asset allocation, and estimates of future long-term returns by asset
class. We attempt to maintain our target asset allocation by rebalancing between asset classes as we make
contributions and monthly benefit payments.