Kraft 2013 Annual Report Download - page 76
Download and view the complete annual report
Please find page 76 of the 2013 Kraft annual report below. You can navigate through the pages in the report by either clicking on the pages listed below, or by using the keyword search tool below to find specific information within the annual report.-
 1
1 -
2
-
3
-
4
-
5
-
6
-
7
-
8
-
9
-
10
-
11
-
12
-
13
-
14
-
15
-
16
-
17
-
18
-
19
-
20
-
21
-
22
-
23
-
24
-
25
-
26
-
27
-
28
-
29
-
30
-
31
-
32
-
33
-
34
-
35
-
36
-
37
-
38
-
39
-
40
-
41
-
42
-
43
-
44
-
45
-
46
-
47
-
48
-
49
-
50
-
51
-
52
-
53
-
54
-
55
-
56
-
57
-
58
-
59
-
60
-
61
-
62
-
63
-
64
-
65
-
 66
66 -
 67
67 -
 68
68 -
 69
69 -
 70
70 -
 71
71 -
 72
72 -
 73
73 -
 74
74 -
 75
75 -
 76
76 -
 77
77 -
 78
78 -
 79
79 -
 80
80 -
 81
81 -
 82
82 -
 83
83 -
 84
84 -
 85
85 -
 86
86 -
87
-
88
-
89
-
90
-
91
-
92
 |
 |

74
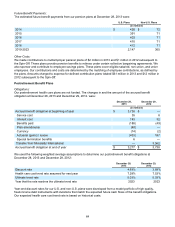
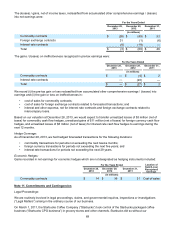
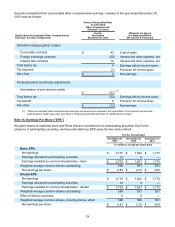
Amounts reclassified from accumulated other comprehensive earnings / (losses) in the year ended December 28,
2013 were as follows:
Amount Reclassified from
Accumulated
Other Comprehensive
Earnings / (Losses)
Details about Accumulated Other Comprehensive
Earnings / (Losses) Components
For the
Year Ended
December 28, 2013
Affected Line Item in
the Statement Where
Net Income is Presented
Derivative hedging (gains) / losses
Commodity contracts $ 42 Cost of sales
Foreign exchange contracts (50) Interest and other expense, net
Interest rate contracts 12 Interest and other expense, net
Total before tax 4 Earnings before income taxes
Tax expense (1) Provision for income taxes
Net of tax $3 Net earnings
Postemployment benefit plan adjustments
Amortization of prior service credits $ (22) (1)
Total before tax (22) Earnings before income taxes
Tax benefit 9 Provision for income taxes
Net of tax $ (13) Net earnings
(1) These accumulated other comprehensive earnings components are included in the computation of net periodic pension and
postretirement health care costs. See Note 9, Postemployment Benefit Plans, for additional information.
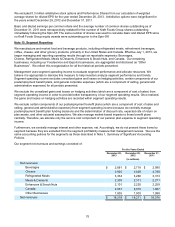
Note 14. Earnings Per Share (“EPS”)
We grant shares of restricted stock and RSUs that are considered to be participating securities. Due to the
presence of participating securities, we have calculated our EPS using the two-class method.
For the Years Ended
December 28,
2013 December 29,
2012 December 31,
2011
(in millions, except per share data)
Basic EPS:
Net earnings $ 2,715 $ 1,642 $ 1,775
Earnings allocated to participating securities 12 5 —
Earnings available to common shareholders - basic $ 2,703 $ 1,637 $ 1,775
Weighted average common shares outstanding 594 591 591
Net earnings per share $ 4.55 $ 2.77 $ 3.00
Diluted EPS:
Net earnings $ 2,715 $ 1,642 $ 1,775
Earnings allocated to participating securities 12 5 —
Earnings available to common shareholders - diluted $ 2,703 $ 1,637 $ 1,775
Weighted average common shares outstanding 594 591 591
Effect of dilutive securities 5 5 —
Weighted average common shares, including dilutive effect 599 596 591
Net earnings per share $ 4.51 $ 2.75 $ 3.00