Kraft 2013 Annual Report Download - page 70
Download and view the complete annual report
Please find page 70 of the 2013 Kraft annual report below. You can navigate through the pages in the report by either clicking on the pages listed below, or by using the keyword search tool below to find specific information within the annual report.-
 1
1 -
2
-
3
-
4
-
5
-
6
-
7
-
8
-
9
-
10
-
11
-
12
-
13
-
14
-
15
-
16
-
17
-
18
-
19
-
20
-
21
-
22
-
23
-
24
-
25
-
26
-
27
-
28
-
29
-
30
-
31
-
32
-
33
-
34
-
35
-
36
-
37
-
38
-
39
-
40
-
41
-
42
-
43
-
44
-
45
-
46
-
47
-
48
-
49
-
50
-
51
-
52
-
53
-
54
-
55
-
56
-
57
-
58
-
59
-
 60
60 -
 61
61 -
 62
62 -
 63
63 -
 64
64 -
 65
65 -
 66
66 -
 67
67 -
 68
68 -
 69
69 -
 70
70 -
 71
71 -
 72
72 -
 73
73 -
 74
74 -
 75
75 -
 76
76 -
 77
77 -
 78
78 -
 79
79 -
 80
80 -
81
-
82
-
83
-
84
-
85
-
86
-
87
-
88
-
89
-
90
-
91
-
92
 |
 |
68
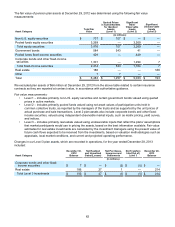
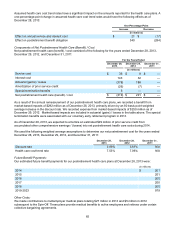
The fair value (asset / (liability)) of our derivative instruments at December 29, 2012 was determined using:
Total
Fair Value
Quoted Prices in
Active Markets
for Identical
Assets
(Level 1)
Significant
Other Observable
Inputs
(Level 2)
Significant
Unobservable
Inputs
(Level 3)
(in millions)
Commodity contracts $ (14) $ (7) $ (7) $ —
Foreign exchange contracts 5— 5 —
Total derivatives $ (9) $ (7) $ (2) $ —
Level 1 financial assets and liabilities consist of commodity futures and options contracts and are valued using
quoted prices in active markets for identical assets and liabilities.
Level 2 financial assets and liabilities consist of commodity forwards and foreign exchange forwards. Commodity
derivatives are valued using an income approach based on the observable market commodity index prices less the
contract rate multiplied by the notional amount. Foreign currency contracts are valued using an income approach
based on observable market forward rates less the contract rate multiplied by the notional amount. Our calculation
of the fair value of financial instruments takes into consideration the risk of nonperformance, including counterparty
credit risk.
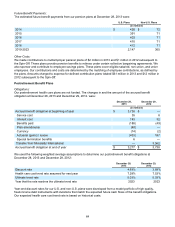
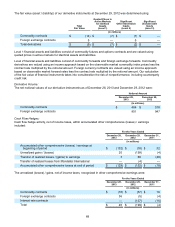
Derivative Volume:
The net notional values of our derivative instruments as of December 28, 2013 and December 29, 2012 were:
Notional Amount
December 28,
2013 December 29,
2012
(in millions)
Commodity contracts $ 484 $ 518
Foreign exchange contracts 901 947
Cash Flow Hedges:
Cash flow hedge activity, net of income taxes, within accumulated other comprehensive (losses) / earnings
included:
For the Years Ended
December 28,
2013 December 29,
2012 December 31,
2011
(in millions)
Accumulated other comprehensive (losses) / earnings at
beginning of period $ (152) $ (18) $ 32
Unrealized gains / (losses) 20 (199) (4)
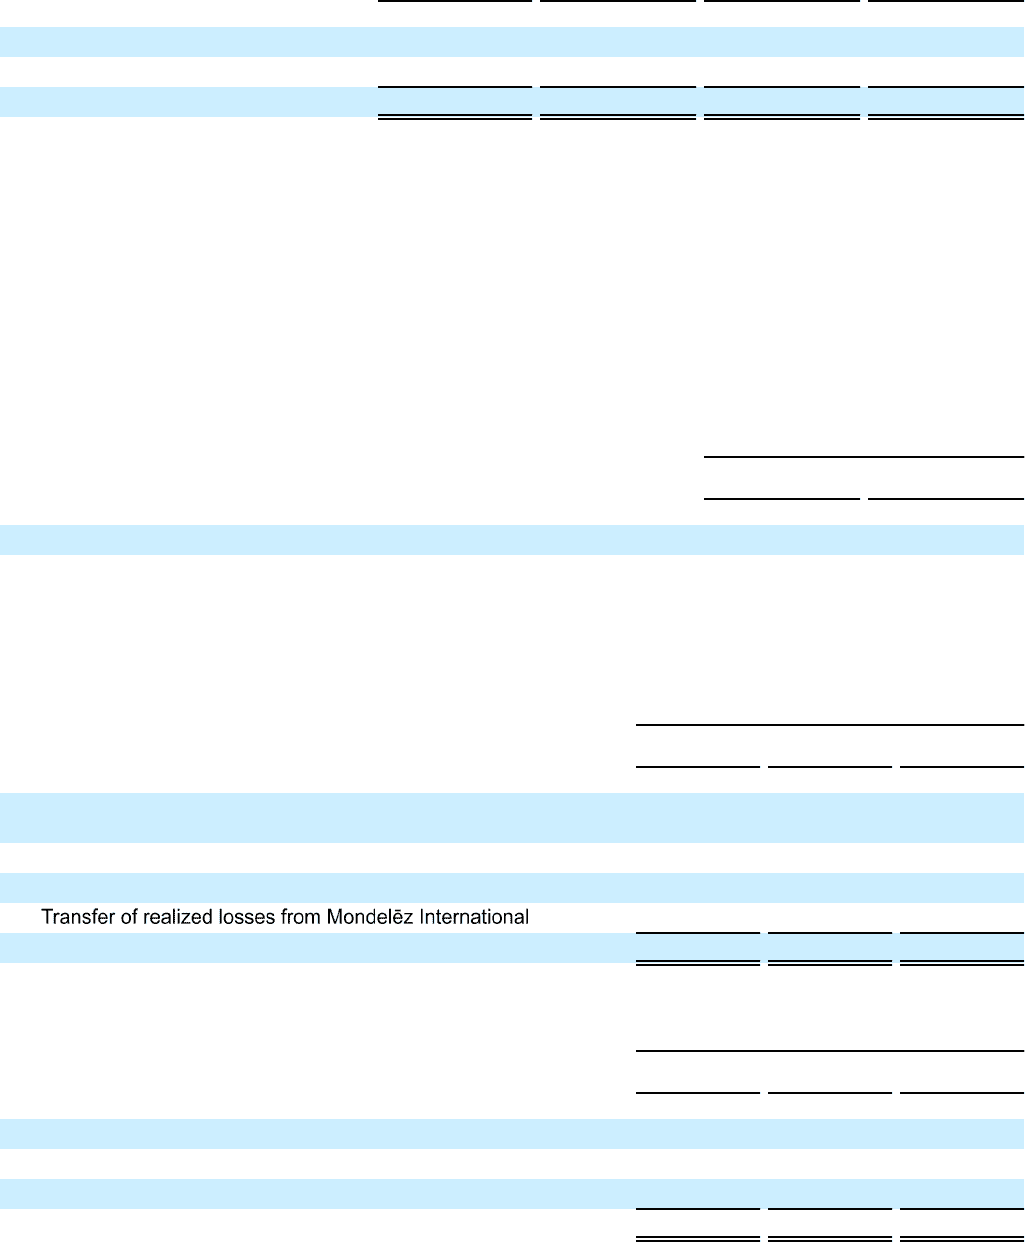
Transfer of realized losses / (gains) to earnings 3 69 (46)
— (4) —
Accumulated other comprehensive losses at end of period $ (129) $ (152) $ (18)
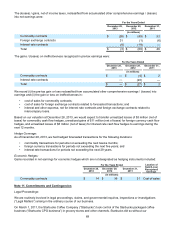
The unrealized (losses) / gains, net of income taxes, recognized in other comprehensive earnings were:
For the Years Ended
December 28,
2013 December 29,
2012 December 31,
2011
(in millions)
Commodity contracts $ (16) $ (57) $ 16
Foreign exchange contracts 36 (5) (4)
Interest rate contracts — (137) (16)
Total $ 20 $ (199) $ (4)