Kraft 2013 Annual Report Download - page 46
Download and view the complete annual report
Please find page 46 of the 2013 Kraft annual report below. You can navigate through the pages in the report by either clicking on the pages listed below, or by using the keyword search tool below to find specific information within the annual report.-
 1
1 -
2
-
3
-
4
-
5
-
6
-
7
-
8
-
9
-
10
-
11
-
12
-
13
-
14
-
15
-
16
-
17
-
18
-
19
-
20
-
21
-
22
-
23
-
24
-
25
-
26
-
27
-
28
-
29
-
30
-
31
-
32
-
33
-
34
-
35
-
 36
36 -
 37
37 -
 38
38 -
 39
39 -
 40
40 -
 41
41 -
 42
42 -
 43
43 -
 44
44 -
 45
45 -
 46
46 -
 47
47 -
 48
48 -
 49
49 -
 50
50 -
 51
51 -
 52
52 -
 53
53 -
 54
54 -
 55
55 -
 56
56 -
57
-
58
-
59
-
60
-
61
-
62
-
63
-
64
-
65
-
66
-
67
-
68
-
69
-
70
-
71
-
72
-
73
-
74
-
75
-
76
-
77
-
78
-
79
-
80
-
81
-
82
-
83
-
84
-
85
-
86
-
87
-
88
-
89
-
90
-
91
-
92
 |
 |

44
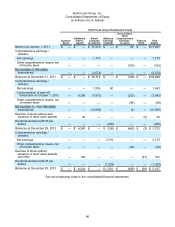
Kraft Foods Group, Inc.
Consolidated Statements of Comprehensive Earnings
(in millions of U.S. dollars)
For the Years Ended
December 28,
2013 December 29,
2012 December 31,
2011
Net earnings $ 2,715 $ 1,642 $ 1,775
Other comprehensive earnings / (losses):
Currency translation adjustment (68) 36 (100)
Postemployment benefits:
Prior service credits arising during the period 31 — —
Amortization of prior service credits (22) (6) —
Tax (expense) / benefit (3) 2 —
Derivatives accounted for as hedges:
Net derivative gains / (losses) 33 (322) (5)
Amounts reclassified from accumulated other comprehensive
earnings 4 112 (75)
Tax (expense) / benefit (14) 80 30
Total other comprehensive losses (39) (98) (150)
Comprehensive earnings $ 2,676 $ 1,544 $ 1,625
See accompanying notes to the consolidated financial statements.