Kraft 2013 Annual Report Download - page 48
Download and view the complete annual report
Please find page 48 of the 2013 Kraft annual report below. You can navigate through the pages in the report by either clicking on the pages listed below, or by using the keyword search tool below to find specific information within the annual report.-
 1
1 -
2
-
3
-
4
-
5
-
6
-
7
-
8
-
9
-
10
-
11
-
12
-
13
-
14
-
15
-
16
-
17
-
18
-
19
-
20
-
21
-
22
-
23
-
24
-
25
-
26
-
27
-
28
-
29
-
30
-
31
-
32
-
33
-
34
-
35
-
36
-
37
-
 38
38 -
 39
39 -
 40
40 -
 41
41 -
 42
42 -
 43
43 -
 44
44 -
 45
45 -
 46
46 -
 47
47 -
 48
48 -
 49
49 -
 50
50 -
 51
51 -
 52
52 -
 53
53 -
 54
54 -
 55
55 -
 56
56 -
 57
57 -
 58
58 -
59
-
60
-
61
-
62
-
63
-
64
-
65
-
66
-
67
-
68
-
69
-
70
-
71
-
72
-
73
-
74
-
75
-
76
-
77
-
78
-
79
-
80
-
81
-
82
-
83
-
84
-
85
-
86
-
87
-
88
-
89
-
90
-
91
-
92
 |
 |

46
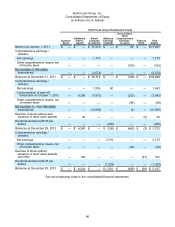
Kraft Foods Group, Inc.
Consolidated Statements of Equity
(in millions of U.S. dollars)
Kraft Foods Group Shareholders’ Equity
Common
Stock
Additional
Paid-in
Capital
Parent
Company
Investment
Retained
Earnings
/ (Deficit)
Accumulated
Other
Comprehensive
Earnings /
(Losses) Treasury
Stock Total
Equity
Balance at January 1, 2011 $ — $ —$ 17,012 $ — $ 25 $ — $17,037
Comprehensive earnings /
(losses):
Net earnings ——1,775 — — — 1,775
Other comprehensive losses, net
of income taxes ——— — (150) — (150)
International ——(2,074) — — — (2,074)
Balances at December 31, 2011 $ — $ —$ 16,713 $ — $ (125) $ — $16,588
Comprehensive earnings /
(losses):
Net earnings ——1,552 90 — — 1,642
Consummation of spin-off
transaction on October 1, 2012 —4,208 (7,670) — (233) — (3,695)
Other comprehensive losses, net
of income taxes ——— — (98) — (98)
International ——(10,595) — (4) — (10,599)
Exercise of stock options and
issuance of other stock awards —32 — — — (2) 30
Dividends declared ($0.50 per
share) ——— (296) — — (296)
Balances at December 29, 2012 $ — $ 4,240 $ — $ (206) $ (460) $ (2) $ 3,572
Comprehensive earnings /
(losses):
Net earnings ——— 2,715 — — 2,715
Other comprehensive losses, net
of income taxes ——— — (39) — (39)
Exercise of stock options,
issuance of other stock awards,
and other — 194 — — — (27) 167
Dividends declared ($2.05 per
share) ——— (1,228) — — (1,228)
Balances at December 28, 2013 $ — $ 4,434 $ — $ 1,281 $ (499) $ (29) $ 5,187
See accompanying notes to the consolidated financial statements.