Kraft 2013 Annual Report Download - page 24
Download and view the complete annual report
Please find page 24 of the 2013 Kraft annual report below. You can navigate through the pages in the report by either clicking on the pages listed below, or by using the keyword search tool below to find specific information within the annual report.-
 1
1 -
2
-
3
-
4
-
5
-
6
-
7
-
8
-
9
-
10
-
11
-
12
-
13
-
 14
14 -
 15
15 -
 16
16 -
 17
17 -
 18
18 -
 19
19 -
 20
20 -
 21
21 -
 22
22 -
 23
23 -
 24
24 -
 25
25 -
 26
26 -
 27
27 -
 28
28 -
 29
29 -
 30
30 -
 31
31 -
 32
32 -
 33
33 -
 34
34 -
35
-
36
-
37
-
38
-
39
-
40
-
41
-
42
-
43
-
44
-
45
-
46
-
47
-
48
-
49
-
50
-
51
-
52
-
53
-
54
-
55
-
56
-
57
-
58
-
59
-
60
-
61
-
62
-
63
-
64
-
65
-
66
-
67
-
68
-
69
-
70
-
71
-
72
-
73
-
74
-
75
-
76
-
77
-
78
-
79
-
80
-
81
-
82
-
83
-
84
-
85
-
86
-
87
-
88
-
89
-
90
-
91
-
92
 |
 |
22
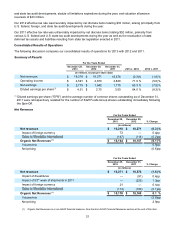
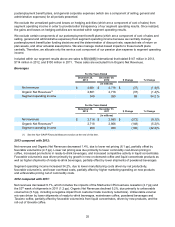
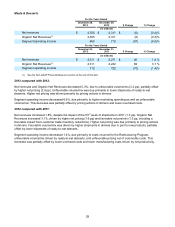
2013 compared with 2012:
Organic Net Revenues were flat as lower net pricing was generally offset by favorable volume/mix. Lower net
pricing (0.6 pp) was due primarily to increased competitive activity in Beverages and Enhancers & Snack Nuts,
partially offset by higher net pricing in Meals & Desserts and Refrigerated Meals. Favorable volume/mix (0.5 pp)
was driven primarily by base business growth, despite an unfavorable product line pruning impact of approximately
one percentage point. Higher sales to International increased net revenues by $33 million while foreign
currency negatively impacted net revenues by $73 million due to the strength of the U.S. dollar relative to the
Canadian dollar.
2012 compared with 2011:
Organic Net Revenues were flat as the impact of higher net pricing was generally offset by unfavorable volume/mix.
Higher net pricing (2.9 pp), including the impact of pricing from prior periods, was realized across all business
segments as we increased pricing to offset higher commodity costs. Unfavorable volume/mix (2.8 pp)reflected lower
shipments in all segments except Meals & Desserts (including negative impacts from product line pruning of
approximately one percentage point and customer trade inventory reductions). Sales to International
increased net revenues by $14 million while unfavorable foreign currency lowered net revenues by $21 million, due
to the strength of the U.S. dollar relative to the Canadian dollar. In 2011, net revenues included a 53rd week of
shipments that added $225 million to net revenues and divestitures (including the Starbucks CPG business) that
contributed $91 million to net revenues.
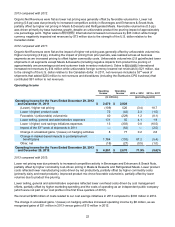
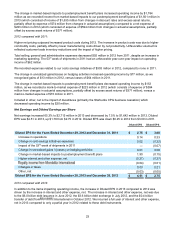
Operating Income
Operating
Income Operating
Income 2013 v. 2012 2012 v. 2011
(in millions) (percentage point)
Operating Income for the Years Ended December 29, 2012
and December 31, 2011 $ 2,670 $ 2,828
(Lower) / higher net pricing (109) 526 (3.4) 18.7
Lower / (higher) product costs 72 (42) 2.3 (1.5)
Favorable / (unfavorable) volume/mix 40 (229) 1.2 (8.1)
Lower selling, general and administrative expenses 131 55 4.1 1.9
Lower / (higher) cost savings initiatives expenses 13 (303) 0.8 (10.5)
Impact of the 53rd week of shipments in 2011 — (62) — (2.5)
Change in unrealized gains / (losses) on hedging activities 8 77 0.2 2.8
Change in market-based impacts to postemployment
benefit plans 1,784 (153) 67.2 (5.4)
Other, net (18) (27) (0.5) (1.0)
Operating Income for the Years Ended December 28, 2013
and December 29, 2012 $ 4,591 $ 2,670 71.9% (5.6)%
2013 compared with 2012:
Lower net pricing was due primarily to increased competitive activity in Beverages and Enhancers & Snack Nuts,
partially offset by higher commodity cost-driven pricing in Meals & Desserts and Refrigerated Meals. Lower product
costs reflected lower manufacturing costs driven by net productivity, partially offset by higher commodity costs
(primarily dairy and meat products). Improved product mix drove favorable volume/mix, partially offset by lower
volumes due to product line pruning.
Lower selling, general and administrative expenses reflected lower overhead costs driven by cost management
efforts, partially offset by higher marketing spending and the costs of operating as an independent public company
(which were not part of our cost profile in the first three quarters of 2012).
We incurred $290 million of costs related to our cost savings initiatives in 2013 compared to $303 million in 2012.
The change in unrealized gains / (losses) on hedging activities increased operating income by $8 million, as we
recognized gains of $21 million in 2013 versus gains of $13 million in 2012.