Kraft 2013 Annual Report Download - page 31
Download and view the complete annual report
Please find page 31 of the 2013 Kraft annual report below. You can navigate through the pages in the report by either clicking on the pages listed below, or by using the keyword search tool below to find specific information within the annual report.-
 1
1 -
2
-
3
-
4
-
5
-
6
-
7
-
8
-
9
-
10
-
11
-
12
-
13
-
14
-
15
-
16
-
17
-
18
-
19
-
20
-
 21
21 -
 22
22 -
 23
23 -
 24
24 -
 25
25 -
 26
26 -
 27
27 -
 28
28 -
 29
29 -
 30
30 -
 31
31 -
 32
32 -
 33
33 -
 34
34 -
 35
35 -
 36
36 -
 37
37 -
 38
38 -
 39
39 -
 40
40 -
 41
41 -
42
-
43
-
44
-
45
-
46
-
47
-
48
-
49
-
50
-
51
-
52
-
53
-
54
-
55
-
56
-
57
-
58
-
59
-
60
-
61
-
62
-
63
-
64
-
65
-
66
-
67
-
68
-
69
-
70
-
71
-
72
-
73
-
74
-
75
-
76
-
77
-
78
-
79
-
80
-
81
-
82
-
83
-
84
-
85
-
86
-
87
-
88
-
89
-
90
-
91
-
92
 |
 |

29
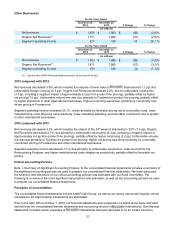
Enhancers & Snack Nuts
For the Years Ended
December 28,
2013 December 29,
2012 $ Change % Change
(in millions)
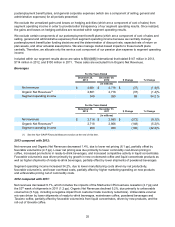
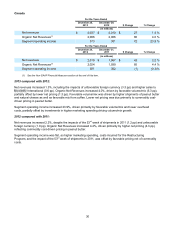
Net revenues $ 2,101 $ 2,220 $ (119) (5.4)%
Organic Net Revenues(1) 2,093 2,217 (124) (5.6)%
Segment operating income 529 592 (63) (10.6)%
For the Years Ended
December 29,
2012 December 31,
2011 $ Change % Change
(in millions)
Net revenues $ 2,220 $ 2,259 $ (39) (1.7)%
Organic Net Revenues(1) 2,217 2,233 (16) (0.7)%
Segment operating income 592 594 (2) (0.3)%
(1) See the Non-GAAP Financial Measures section at the end of this item.
2013 compared with 2012:
Net revenues decreased 5.4% and Organic Net Revenues decreased 5.6%, due to lower net pricing (3.3 pp) and
unfavorable volume/mix (2.3 pp, including a negative impact of approximately 0.8 pp due to product line pruning in
snack bars). Lower net pricing was due primarily to increased competitive activity in spoonable and pourable
dressings and commodity cost-driven pricing in snack nuts. Unfavorable volume/mix was due primarily to lower
shipments of pourable and spoonable dressings, partially offset by higher shipments of snack nuts.
Segment operating income decreased 10.6%, due to increased competitive spending in spoonable and pourable
salad dressings, unfavorable pricing net of commodity costs in snack nuts, higher marketing spending in snack
nuts, spoonable dressings, and pourable dressings, and unfavorable volume/mix. This decrease was partially
offset by lower overhead costs and lower manufacturing costs driven by net productivity.
2012 compared with 2011:
Net revenues decreased 1.7%, which includes the impact of the 53rd week of shipments in 2011 (1.1 pp). Organic
Net Revenues decreased 0.7%, due to unfavorable volume/mix (9.4 pp, including negative impacts from customer
trade inventory reductions and approximately 0.8 pp due from product line pruning), partially offset by higher net
pricing (8.7 pp). Unfavorable volume/mix was due primarily to lower shipments in snack nuts, spoonable dressings,
and pourable dressings. Higher net pricing was due primarily to commodity cost-driven pricing actions in snack
nuts, pourable dressings and spoonable dressings.
Segment operating income decreased 0.3%, due primarily to unfavorable volume/mix and costs incurred for the
Restructuring Program, partially offset by favorable pricing net of commodity costs and lower overhead costs.