Kraft 2013 Annual Report Download - page 62
Download and view the complete annual report
Please find page 62 of the 2013 Kraft annual report below. You can navigate through the pages in the report by either clicking on the pages listed below, or by using the keyword search tool below to find specific information within the annual report.-
 1
1 -
2
-
3
-
4
-
5
-
6
-
7
-
8
-
9
-
10
-
11
-
12
-
13
-
14
-
15
-
16
-
17
-
18
-
19
-
20
-
21
-
22
-
23
-
24
-
25
-
26
-
27
-
28
-
29
-
30
-
31
-
32
-
33
-
34
-
35
-
36
-
37
-
38
-
39
-
40
-
41
-
42
-
43
-
44
-
45
-
46
-
47
-
48
-
49
-
50
-
51
-
 52
52 -
 53
53 -
 54
54 -
 55
55 -
 56
56 -
 57
57 -
 58
58 -
 59
59 -
 60
60 -
 61
61 -
 62
62 -
 63
63 -
 64
64 -
 65
65 -
 66
66 -
 67
67 -
 68
68 -
 69
69 -
 70
70 -
 71
71 -
 72
72 -
73
-
74
-
75
-
76
-
77
-
78
-
79
-
80
-
81
-
82
-
83
-
84
-
85
-
86
-
87
-
88
-
89
-
90
-
91
-
92
 |
 |
60
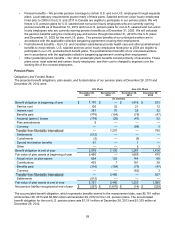
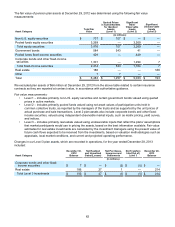
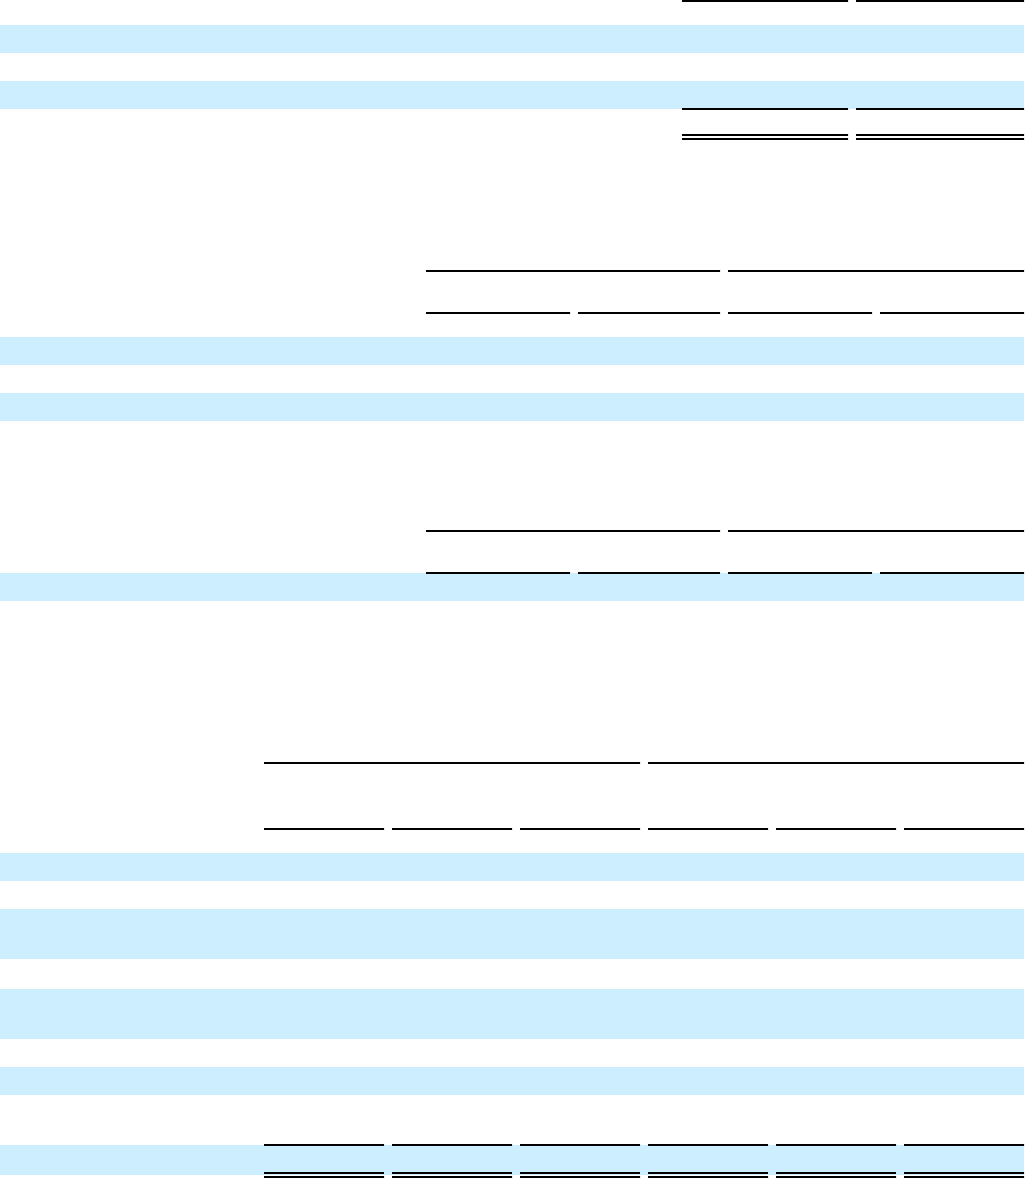
The combined U.S. and non-U.S. pension plans resulted in a net pension liability of $271 million at December 28,
2013 and $1,999 million at December 29, 2012. We recognized these amounts in our consolidated balance sheets
at December 28, 2013 and December 29, 2012 as follows:
December 28,
2013 December 29,
2012
(in millions)
Prepaid pension assets $ 162 $ 15
Other current liabilities (28) (24)
Accrued pension costs (405) (1,990)
$ (271) $ (1,999)
Certain of our U.S. and non-U.S. plans are underfunded and have accumulated benefit obligations in excess of plan
assets. For these plans, the projected benefit obligations, accumulated benefit obligations, and the fair value of plan
assets at December 28, 2013 and December 29, 2012 were:
U.S. Plans Non-U.S. Plans
December 28,
2013 December 29,
2012 December 28,
2013 December 29,
2012
(in millions)
Projected benefit obligation $ 203 $ 7,130 $ 52 $ 1,319
Accumulated benefit obligation 186 6,802 44 1,205
Fair value of plan assets 17 5,460 — 975
We used the following weighted average assumptions to determine our benefit obligations under the pension plans
at December 28, 2013 and December 29, 2012:
U.S. Plans Non-U.S. Plans
December 28,
2013 December 29,
2012 December 28,
2013 December 29,
2012
Discount rate 4.94% 4.05% 4.56% 4.00%
Rate of compensation increase 4.00% 4.00% 3.00% 3.00%
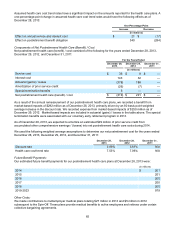
Components of Net Pension (Benefit) / Cost:
Net periodic pension (benefit) / cost consisted of the following for the years ended December 28, 2013, December
29, 2012, and December 31, 2011:
U.S. Plans Non-U.S. Plans
For the Years Ended For the Years Ended
December 28,
2013 December 29,
2012 December 31,
2011 December 28,
2013 December 29,
2012 December 31,
2011
(in millions)
Service cost $ 100 $ 32 $ — $ 21 $ 12 $ 7
Interest cost 287 70 — 55 32 26
Expected return on plan
assets (315)(105) — (57) (43) (35)
Actuarial (gains) / losses (1,154)(41) — (128) 28 84
Amortization of prior
service cost 4 1 ————
Settlements 69 — ————
Curtailments (3)—— (9) — —
Special termination
benefits 61 — — 1 — —
Net pension (benefit) / cost $ (951) $ (43) $ — $ (117) $ 29 $ 82
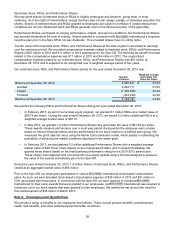
We remeasure all of our postemployment benefit plans at least annually at the end of our fiscal year. The
remeasurement as of December 28, 2013, resulted in an aggregate benefit from market-based impacts of $1.3
billion primarily driven by an 80 basis point weighted average increase in the discount rate and excess asset