Kraft 2013 Annual Report Download - page 30
Download and view the complete annual report
Please find page 30 of the 2013 Kraft annual report below. You can navigate through the pages in the report by either clicking on the pages listed below, or by using the keyword search tool below to find specific information within the annual report.-
 1
1 -
2
-
3
-
4
-
5
-
6
-
7
-
8
-
9
-
10
-
11
-
12
-
13
-
14
-
15
-
16
-
17
-
18
-
19
-
 20
20 -
 21
21 -
 22
22 -
 23
23 -
 24
24 -
 25
25 -
 26
26 -
 27
27 -
 28
28 -
 29
29 -
 30
30 -
 31
31 -
 32
32 -
 33
33 -
 34
34 -
 35
35 -
 36
36 -
 37
37 -
 38
38 -
 39
39 -
 40
40 -
41
-
42
-
43
-
44
-
45
-
46
-
47
-
48
-
49
-
50
-
51
-
52
-
53
-
54
-
55
-
56
-
57
-
58
-
59
-
60
-
61
-
62
-
63
-
64
-
65
-
66
-
67
-
68
-
69
-
70
-
71
-
72
-
73
-
74
-
75
-
76
-
77
-
78
-
79
-
80
-
81
-
82
-
83
-
84
-
85
-
86
-
87
-
88
-
89
-
90
-
91
-
92
 |
 |

28
Meals & Desserts
For the Years Ended
December 28,
2013 December 29,
2012 $ Change % Change
(in millions)
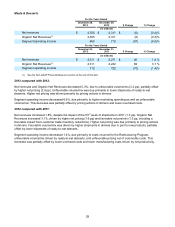
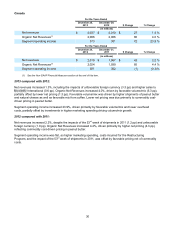
Net revenues $ 2,305 $ 2,311 $ (6) (0.3)%
Organic Net Revenues(1) 2,305 2,311 (6) (0.3)%
Segment operating income 665 712 (47) (6.6)%
For the Years Ended
December 29,
2012 December 31,
2011 $ Change % Change
(in millions)
Net revenues $ 2,311 $ 2,271 $ 40 1.8 %
Organic Net Revenues(1) 2,311 2,242 69 3.1 %
Segment operating income 712 722 (10) (1.4)%
(1) See the Non-GAAP Financial Measures section at the end of this item.
2013 compared with 2012:
Net revenues and Organic Net Revenues decreased 0.3%, due to unfavorable volume/mix (3.2 pp), partially offset
by higher net pricing (2.9 pp). Unfavorable volume/mix was due primarily to lower shipments of ready-to-eat
desserts. Higher net pricing was driven primarily by pricing actions in dinners.
Segment operating income decreased 6.6%, due primarily to higher marketing spending as well as unfavorable
volume/mix. This decrease was partially offset by pricing actions in dinners and lower overhead costs.
2012 compared with 2011:
Net revenues increased 1.8%, despite the impact of the 53rd week of shipments in 2011 (1.3 pp). Organic Net
Revenues increased 3.1%, driven by higher net pricing (1.6 pp) and favorable volume/mix (1.5 pp, including a
favorable impact from customer trade inventory reductions). Higher net pricing was due primarily to pricing actions
in dinners. Favorable volume/mix was driven by higher shipments in dinners due in part to new products, partially
offset by lower shipments of ready-to-eat desserts.
Segment operating income decreased 1.4%, due primarily to costs incurred for the Restructuring Program,
unfavorable volume/mix driven by ready-to-eat desserts, and unfavorable pricing net of commodity costs. This
decrease was partially offset by lower overhead costs and lower manufacturing costs driven by net productivity.