Kraft 2013 Annual Report Download - page 27
Download and view the complete annual report
Please find page 27 of the 2013 Kraft annual report below. You can navigate through the pages in the report by either clicking on the pages listed below, or by using the keyword search tool below to find specific information within the annual report.-
 1
1 -
2
-
3
-
4
-
5
-
6
-
7
-
8
-
9
-
10
-
11
-
12
-
13
-
14
-
15
-
16
-
 17
17 -
 18
18 -
 19
19 -
 20
20 -
 21
21 -
 22
22 -
 23
23 -
 24
24 -
 25
25 -
 26
26 -
 27
27 -
 28
28 -
 29
29 -
 30
30 -
 31
31 -
 32
32 -
 33
33 -
 34
34 -
 35
35 -
 36
36 -
 37
37 -
38
-
39
-
40
-
41
-
42
-
43
-
44
-
45
-
46
-
47
-
48
-
49
-
50
-
51
-
52
-
53
-
54
-
55
-
56
-
57
-
58
-
59
-
60
-
61
-
62
-
63
-
64
-
65
-
66
-
67
-
68
-
69
-
70
-
71
-
72
-
73
-
74
-
75
-
76
-
77
-
78
-
79
-
80
-
81
-
82
-
83
-
84
-
85
-
86
-
87
-
88
-
89
-
90
-
91
-
92
 |
 |

25
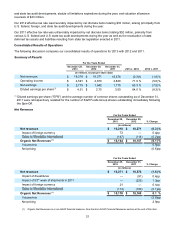
postemployment benefit plans, and general corporate expenses (which are a component of selling, general and
administrative expenses) for all periods presented.
We exclude the unrealized gains and losses on hedging activities (which are a component of cost of sales) from
segment operating income in order to provide better transparency of our segment operating results. Once realized,
the gains and losses on hedging activities are recorded within segment operating results.
We exclude certain components of our postemployment benefit plans (which are a component of cost of sales and
selling, general and administrative expenses) from segment operating income because we centrally manage
postemployment benefit plan funding decisions and the determination of discount rate, expected rate of return on
plan assets, and other actuarial assumptions. We also manage market-based impacts to these benefit plans
centrally. Therefore, we allocate only the service cost component of our pension plan expense to segment operating
income.
Included within our segment results above are sales to International that totaled $147 million in 2013,
$114 million in 2012, and $100 million in 2011. These sales are excluded from Organic Net Revenues.
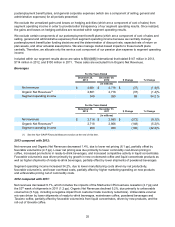
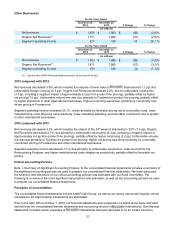
Beverages
For the Years Ended
December 28,
2013 December 29,
2012 $ Change % Change
(in millions)
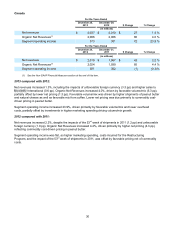
Net revenues $ 2,681 $ 2,718 $ (37) (1.4)%
Organic Net Revenues(1) 2,681 2,718 (37) (1.4)%
Segment operating income 349 260 89 34.2 %
For the Years Ended
December 29,
2012 December 31,
2011 $ Change % Change
(in millions)
Net revenues $ 2,718 $ 2,990 $ (272) (9.1)%
Organic Net Revenues(1) 2,718 2,866 (148) (5.2)%
Segment operating income 260 450 (190) (42.2)%
(1) See the Non-GAAP Financial Measures section at the end of this item.
2013 compared with 2012:
Net revenues and Organic Net Revenues decreased 1.4%, due to lower net pricing (6.1 pp), partially offset by
favorable volume/mix (4.7 pp). Lower net pricing was due primarily to lower commodity cost-driven pricing in
coffee, increased promotions in ready-to-drink beverages, and increased competitive activity in liquid concentrates.
Favorable volume/mix was driven primarily by growth in new on-demand coffee and liquid concentrate products as
well as higher shipments of ready-to-drink beverages, partially offset by lower shipments of powdered beverages.
Segment operating income increased 34.2%, due to lower manufacturing costs driven by net productivity,
favorable volume/mix, and lower overhead costs, partially offset by higher marketing spending on new products
and unfavorable pricing net of commodity costs.
2012 compared with 2011:
Net revenues decreased 9.1%, which includes the impacts of the Starbucks CPG business cessation (2.7 pp) and
the 53rd week of shipments in 2011 (1.2 pp). Organic Net Revenues declined 5.2%, due primarily to unfavorable
volume/mix (5.5 pp, including a negative impact from customer trade inventory reductions). Unfavorable volume/
mix was driven by lower shipments of ready-to-drink beverages, mainstream coffee, powdered beverages and
Tassimo coffee, partially offset by favorable volume/mix from liquid concentrates, driven by new products, and the
roll-out of Gevalia coffee.