Kraft 2013 Annual Report Download
Download and view the complete annual report
Please find the complete 2013 Kraft annual report below. You can navigate through the pages in the report by either clicking on the pages listed below, or by using the keyword search tool below to find specific information within the annual report.-
 1
1 -
 2
2 -
 3
3 -
 4
4 -
 5
5 -
 6
6 -
 7
7 -
 8
8 -
 9
9 -
 10
10 -
 11
11 -
 12
12 -
13
-
14
-
15
-
16
-
17
-
18
-
19
-
20
-
21
-
22
-
23
-
24
-
25
-
26
-
27
-
28
-
29
-
30
-
31
-
32
-
33
-
34
-
35
-
36
-
37
-
38
-
39
-
40
-
41
-
42
-
43
-
44
-
45
-
46
-
47
-
48
-
49
-
50
-
51
-
52
-
53
-
54
-
55
-
56
-
57
-
58
-
59
-
60
-
61
-
62
-
63
-
64
-
65
-
66
-
67
-
68
-
69
-
70
-
71
-
72
-
73
-
74
-
75
-
76
-
77
-
78
-
79
-
80
-
81
-
82
-
83
-
84
-
85
-
86
-
87
-
88
-
89
-
90
-
91
-
92
 |
 |

UNITED STATES
SECURITIES AND EXCHANGE COMMISSION
WASHINGTON, D.C. 20549
FORM 10-K
(Mark One)
ANNUAL REPORT PURSUANT TO SECTION 13 OR 15(d) OF THE SECURITIES EXCHANGE ACT OF 1934
For the fiscal year ended December 28, 2013
OR
TRANSITION REPORT PURSUANT TO SECTION 13 OR 15(d) OF THE SECURITIES EXCHANGE ACT OF 1934
For the transition period from to
Commission file number 1-35491
Kraft Foods Group, Inc.
(Exact name of registrant as specified in its charter)
Virginia 36-3083135
(State or other jurisdiction of incorporation or organization) (I.R.S. Employer Identification No.)
Three Lakes Drive, Northfield, Illinois 60093-2753
(Address of principal executive offices) (Zip Code)
Registrant’s telephone number, including area code: (847) 646-2000
Securities registered pursuant to Section 12(b) of the Act:
Title of each class Name of each exchange on which registered
Common Stock, no par value The NASDAQ Stock Market LLC
Securities registered pursuant to Section 12(g) of the Act: None
Indicate by check mark if the registrant is a well-known seasoned issuer, as defined in Rule 405 of the Securities Act.
Yes No
Indicate by check mark if the registrant is not required to file reports pursuant to Section 13 or Section 15(d) of the Act.
Yes No
Note: Checking the box above will not relieve any registrant required to file reports pursuant to Section 13 or 15(d) of
the Exchange Act from their obligations under those sections.
Indicate by check mark whether the registrant (1) has filed all reports required to be filed by Section 13 or 15(d) of the
Securities Exchange Act of 1934 during the preceding 12 months (or for such shorter period that the registrant was required to
file such reports), and (2) has been subject to such filing requirements for the past 90 days. Yes No
Indicate by check mark whether the registrant has submitted electronically and posted on its corporate Web site, if any,
every Interactive Data File required to be submitted and posted pursuant to Rule 405 of Regulation S-T (§ 232.405 of this
chapter) during the preceding 12 months (or for such shorter period that the registrant was required to submit and post such
files). Yes No
Indicate by check mark if disclosure of delinquent filers pursuant to Item 405 of Regulation S-K (§ 229.405 of this
chapter) is not contained herein, and will not be contained, to the best of registrant's knowledge, in definitive proxy or information
statements incorporated by reference in Part III of this Form 10-K or any amendment to this Form 10-K.
Indicate by check mark whether the registrant is a large accelerated filer, an accelerated filer, a non-accelerated filer, or
a smaller reporting company. See the definitions of “large accelerated filer,” “accelerated filer” and “smaller reporting company” in
Rule 12b-2 of the Exchange Act. (Check one):
Large accelerated filer Accelerated filer Non-accelerated filer Smaller reporting company
(Do not check if smaller reporting company)
Indicate by check mark whether the registrant is a shell company (as defined in Rule 12b-2 of the Exchange
Act). Yes No
The aggregate market value of the shares of common stock held by non-affiliates of the registrant, computed by
reference to the closing price of such stock as of the last business day of the registrant's most recently completed second
quarter, was $33 billion. At January 25, 2014, there were 596,311,563 shares of the registrant’s common stock outstanding.
Documents Incorporated by Reference
Portions of the registrant's definitive proxy statement to be filed with the Securities and Exchange Commission in
connection with its annual meeting of shareholders expected to be held on May 6, 2014 are incorporated by reference into Part
III hereof.
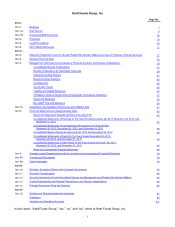
Table of contents
-
Page 1
...whether the registrant is a shell company (as defined in Rule 12b-2 of the Exchange Yes No The aggregate market value of the shares of common stock held by non-affiliates of the registrant, computed by reference to the closing price of such stock as of the last business day of the registrant's most... -
Page 2
...Management's Discussion and Analysis of Financial Condition and Results of Operations: Consolidated Results of Operations Results of Operations by Reportable Segments Critical Accounting Policies New Accounting Guidance Contingencies Commodity Trends Liquidity and Capital Resources Off-Balance Sheet... -
Page 3
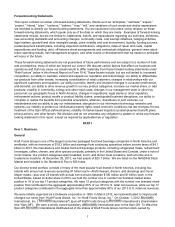
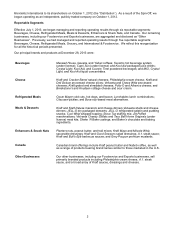
... before income taxes of $4.1 billion in 2013. We manufacture and market food and beverage products, including refrigerated meals, refreshment beverages, coffee, cheese, and other grocery products, primarily in the United States and Canada, under a host of iconic brands. Our product categories... -
Page 4
...; Velveeta Cheesy Skillets and Taco Bell Home Originals (under license) meal kits; Shake 'N Bake coatings; and Baker's chocolate and baking ingredients. Planters nuts, peanut butter, and trail mixes; Kraft Mayo and Miracle Whip spoonable dressings; Kraft and Good Seasons salad dressings; A.1. steak... -
Page 5
...customers on developing strategies for new item introduction, category and assortment management, shopper insights, shopper marketing, trade and promotional planning, and retail pricing solutions. We have a dedicated headquarter customer team covering all of our product lines for many of our largest... -
Page 6
..., third-party logistics providers perform storage and distribution services for us to support our distribution network. We rely on common carriers and our private fleet to transport our products from our manufacturing and processing facilities to our distribution facilities and on to our customers... -
Page 7
...to particular brands and products. We maintain three key technology centers, each equipped with pilot plants and state-of-the-art instruments. Research and development expense was approximately $118 million (including a benefit from market-based impacts related to our postemployment benefit plans of... -
Page 8
... generated approximately 14% of our 2013 and 2012 consolidated net revenues, and 13% of our 2011 consolidated net revenues outside the United States, primarily in Canada. For additional information about our foreign operations, see Note 15, Segment Reporting, to the consolidated financial statements... -
Page 9
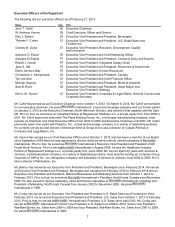
... Mr. Cahill will transition International, a food and beverage company and our former parent, to non-executive chairman. He joined on January 2, 2012 as the Executive Chairman, North American Grocery, and served in that capacity until the SpinOff. Prior to that, he served as an Industrial Partner at... -
Page 10
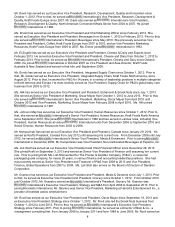
..., Kraft Foods Europe since 2007. Mr. Davis also served as International's Vice President, Research, Development & Quality, North American Convenient Meals Sector from 2004 to 2007. He joined International in 1984. Ms. Elsner has served as our Executive Vice President and Chief Marketing Officer... -
Page 11
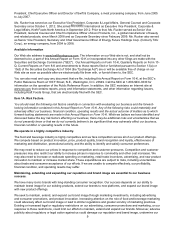
... and Chief Governance Officer of Energy Future Holdings Corp. (formerly TXU Corp.), an energy company, from 2004 to 2008. Available Information Our Web site address is www.kraftfoodsgroup.com. The information on our Web site is not, and shall not be deemed to be, a part of this Annual Report on Form... -
Page 12
... develop supply chains that permit them to operate with reduced inventories or to develop and market their own retailer brands. Retail consolidation and increasing retailer power could materially and adversely affect our product sales, financial condition, and operating results. Retail consolidation... -
Page 13
... affect our product sales, financial condition, and operating results. In addition, achieving growth depends on our successful development, introduction, and marketing of innovative new products and line extensions. Successful innovation depends on our ability to correctly anticipate customer and... -
Page 14
...sales, financial condition, and operating results. Unanticipated business disruptions could adversely affect our ability to provide our products to our customers. We have a complex network of suppliers, owned manufacturing locations, co-manufacturing locations, distribution networks, and information... -
Page 15
...number of benefit plans for employees in the United States and Canada, including defined benefit pension plans, retiree health and welfare, active health care, severance, and other postemployment benefits. As of December 28, 2013, the projected benefit obligation of our defined benefit pension plans... -
Page 16
... manage a variety of business processes and activities, and to comply with regulatory, legal, and tax requirements. We also depend on our information technology infrastructure for digital marketing activities and for electronic communications among our locations, personnel, customers, and suppliers... -
Page 17
...included steps to separate the assets and liabilities in Canada held in connection with International's global snacks business from the assets and liabilities in Canada held in connection with our North American grocery business. Our Canadian subsidiary received an advance income tax ruling from the... -
Page 18
..., Illinois. Our headquarters are leased and house our executive offices, certain U.S. business units, and our administrative, finance, and human resource functions. We maintain additional owned and leased offices and three technology centers in the United States and Canada. We have 36 manufacturing... -
Page 19
... future be involved, we do not expect that the ultimate costs to resolve any of the Legal Matters that are currently pending will have a material adverse effect on our financial condition or results of operations. Item 4. Mine Safety Disclosures. Not applicable. PART II Item 5. Market for Registrant... -
Page 20
...3,000,000,000 Includes shares tendered by individuals who used shares to exercise options or to pay the related taxes for grants of restricted stock, restricted stock units, and Performance Shares (as defined below) that vested. On December 17, 2013, our Board of Directors authorized a $3.0 billion... -
Page 21
... United States and Canada. Our product categories span all major meal occasions, both at home and in foodservice locations. We were a wholly owned subsidiary of International until October 1, 2012. On that date, International spun-off Kraft Foods Group, comprising the North American grocery business... -
Page 22
... and Canada segments through March 1, 2011. Provision for Income Taxes Our effective tax rate was 33.6% in 2013, 33.1% in 2012, and 38.3% in 2011. Our 2013 effective tax rate was unfavorably impacted by an increase in earnings due to the remeasurements of certain postemployment benefit plans and... -
Page 23
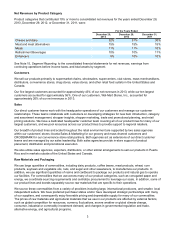
... restated for the number of Kraft Foods Group shares outstanding immediately following the Spin-Off. Net Revenues For the Years Ended December 28, 2013 December 29, 2012 % Change (in millions) Net revenues Impact of foreign currency Organic Net Revenues (1) Volume/mix Net pricing $ $ 18,218... -
Page 24
...) cost savings initiatives expenses Impact of the 53rd week of shipments in 2011 Change in unrealized gains / (losses) on hedging activities Change in market-based impacts to postemployment benefit plans Other, net Operating Income for the Years Ended December 28, 2013 and December 29, 2012 $ 2013... -
Page 25
... manufacturing costs driven by net productivity. Unfavorable volume/mix reflected customer trade inventory reductions and the impact of higher pricing. Total selling, general and administrative expenses decreased $55 million in 2012 from 2011, despite an increase in marketing spending. The 53rd week... -
Page 26
...2011 Earnings before income taxes: Operating income: Beverages Cheese Refrigerated Meals Meals & Desserts Enhancers & Snack Nuts Canada Other Businesses Unrealized gains / (losses) on hedging activities Certain postemployment benefit plan income / (costs) General corporate expenses Operating income... -
Page 27
...sales and selling, general and administrative expenses) from segment operating income because we centrally manage postemployment benefit plan funding decisions and the determination of discount rate, expected rate of return on plan assets, and other actuarial assumptions. We also manage market-based... -
Page 28
...voluntary string cheese recall. Segment operating income increased 2.6% as lower marketing spending, lower overhead costs, favorable volume/ mix, and lower manufacturing costs driven by net productivity were partially offset by unfavorable pricing net of commodity costs. 2012 compared with 2011: Net... -
Page 29
... Higher net pricing was due to commodity cost-driven pricing primarily related to lunch combinations and hot dogs. Unfavorable volume/ mix was due primarily to product line pruning and lower shipments in hot dogs, partially offset by favorable mix in cold cuts. Segment operating income increased 18... -
Page 30
... from customer trade inventory reductions). Higher net pricing was due primarily to pricing actions in dinners. Favorable volume/mix was driven by higher shipments in dinners due in part to new products, partially offset by lower shipments of ready-to-eat desserts. Segment operating income decreased... -
Page 31
... nuts. Segment operating income decreased 10.6%, due to increased competitive spending in spoonable and pourable salad dressings, unfavorable pricing net of commodity costs in snack nuts, higher marketing spending in snack nuts, spoonable dressings, and pourable dressings, and unfavorable volume/mix... -
Page 32
...from coffee. Lower net pricing was due primarily to commodity costdriven pricing in peanut butter. Segment operating income increased 23.9%, driven primarily by favorable volume/mix and lower overhead costs, partially offset by investments in higher marketing spending driving volume/mix growth. 2012... -
Page 33
... in Foodservice. Segment operating income increased 26.1%, driven primarily by favorable pricing net of commodity costs, lower manufacturing costs driven by net productivity, lower marketing spending, and favorable volume/mix due to growth in other international businesses. 2012 compared with 2011... -
Page 34
including general corporate expenses related to finance, legal, information technology, human resources, compliance, shared services, insurance, employee benefits and incentives, and stock-based compensation. These expenses were allocated in our historical results of operations on the basis of ... -
Page 35
... in 2013, 2012 or 2011. Marketing and Research and Development: We promote our products with advertising, consumer incentives, and trade promotions. Consumer incentives and trade promotions include, but are not limited to, discounts, coupons, rebates, in-store display incentives, and volume-based... -
Page 36
... reported for the health care plans. A one-percentage-point change in assumed health care cost trend rates would have the following effects as of December 28, 2013: One-Percentage-Point Increase (in millions) Decrease Effect on annual service and interest cost Effect on postretirement benefit... -
Page 37
...from International in 2012 compared to 2011, on an annualized basis, is due to an increase in the benefit plan costs recognized by International in 2012 driven by a decrease in the discount rate used. Income Taxes: We recognize income taxes based on amounts refundable or payable for the current year... -
Page 38
...to the consolidated financial statements for a discussion of contingencies. Commodity Trends We purchase large quantities of commodities, including dairy products, coffee beans, meat products, wheat, corn products, soybean and vegetable oils, nuts, and sugar and other sweeteners. In addition, we use... -
Page 39
...to the consolidated financial statements, we have thirdparty guarantees primarily covering long-term obligations related to leased properties. The carrying amount of our third-party guarantees on our consolidated balance sheet was $24 million at December 28, 2013 and $22 million at December 29, 2012... -
Page 40
... the consolidated balance sheet as accounts payable and accrued liabilities are excluded from the table above. In order to align cash flows with expenses and reduce volatility, we have executed a level funding strategy. Based on our level funding strategy, we estimate that 2014 pension contributions... -
Page 41
...2013. No dividends were paid in 2012 or 2011. The present annualized dividend rate is $2.10 per common share. The declaration of dividends is subject to the discretion of our Board of Directors and depends on various factors, including our net earnings, financial condition, cash requirements, future... -
Page 42
... to 2011 Sales to Net Revenues Impact of Currency International Impact of Divestitures (in millions) Impact of 53rd Week of Shipments in 2011 Organic Net Revenues Year Ended December 29, 2012 Beverages Cheese Refrigerated Meals Meals & Desserts Enhancers & Snack Nuts Canada Other Businesses Total... -
Page 43
... Accounting Policies, and Note 10, Financial Instruments, to the consolidated financial statements for further details of our commodity price, foreign currency, and interest rate risk management policies and the types of derivative instruments we use to hedge those exposures. Value at Risk: We use... -
Page 44
..., on the financial statement schedule, and on the Company's internal control over financial reporting based on our audits (which were integrated audits in 2013 and 2012). We conducted our audits in accordance with the standards of the Public Company Accounting Oversight Board (United States). Those... -
Page 45
Kraft Foods Group, Inc. Consolidated Statements of Earnings (in millions of U.S. dollars, except per share data) For the Years Ended December 28, 2013 December 29, 2012 December 31, 2011 Net revenues Cost of sales Gross profit Selling, general and administrative expenses Asset impairment and exit ... -
Page 46
... Foods Group, Inc. Consolidated Statements of Comprehensive Earnings (in millions of U.S. dollars) For the Years Ended December 28, 2013 December 29, 2012 December 31, 2011 Net earnings Other comprehensive earnings / (losses): Currency translation adjustment Postemployment benefits: Prior service... -
Page 47
...-term debt Deferred income taxes Accrued pension costs Accrued postretirement health care costs Other liabilities TOTAL LIABILITIES Commitments and Contingencies (Note 11) EQUITY Common stock, no par value (5,000,000,000 shares authorized; 596,843,449 shares issued at December 28, 2013 and 592,783... -
Page 48
... (Losses) Common Stock Additional Paid-in Capital Parent Company Investment Retained Earnings / (Deficit) Treasury Stock Total Equity Balance at January 1, 2011 $ Comprehensive earnings / (losses): Net earnings Other comprehensive losses, net of income taxes International Balances at December... -
Page 49
...29, 2012 December 31, 2011 CASH PROVIDED BY / (USED IN) OPERATING ACTIVITIES Net earnings Adjustments to reconcile net earnings to operating cash flows: Depreciation Stock-based compensation expense Deferred income tax provision Asset impairments Market-based impacts to postemployment benefit plans... -
Page 50
... Canada. Our product categories span all major meal occasions, both at home and in foodservice locations. On October 1, 2012, International, Inc. International," formerly known as Kraft Foods Inc.) created us as an independent public company through a spin-off of its North American grocery business... -
Page 51
... on historical and current period experience. Shipping and handling costs related to product returns are included in cost of sales and were not material in 2013, 2012 or 2011. Marketing and Research and Development: We promote our products with advertising, consumer incentives, and trade promotions... -
Page 52
... the working life of the covered employees. In December of 2012, we elected to change our method of accounting for defined benefit costs to a mark-to-market policy. Under this accounting method, we recognize net actuarial gains or losses and changes in the fair value of plan assets in cost of sales... -
Page 53
...year be governed by an International Swaps and Derivatives Association master agreement. We are also exposed to market risk as the value of our financial instruments might be adversely affected by a change in foreign currency exchange rates, commodity prices, or interest rates. We manage market risk... -
Page 54
... 29, 2012 for this change. This misstatement was not material to any of our prior period financial statements. New Accounting Pronouncements: In July 2013, the Financial Accounting Standards Board issued an accounting standard update which will require us to present an unrecognized tax benefit as... -
Page 55
... Goodwill and Intangible Assets Goodwill by reportable segment at December 28, 2013 and December 29, 2012 was: December 28, 2013 December 29, 2012 (in millions) Beverages Cheese Refrigerated Meals Meals & Desserts Enhancers & Snack Nuts Canada Other Businesses Goodwill $ $ 1,290 3,000 985 1,572... -
Page 56
...Off Transition Costs For the Year Ended December 29, 2012 Restructuring Costs Implementation Costs Spin-Off Transition Costs Total Total (in millions) Beverages Cheese Refrigerated Meals Meals & Desserts Enhancers & Snack Nuts Canada Other Businesses Corporate expenses Total $ $ 19 26 18 14 12 10... -
Page 57
... the carrying value of $10.0 billion. At December 29, 2012, the aggregate fair value of our total debt was $11.5 billion as compared with the carrying value of $10.0 billion. We determined the fair value of our long-term debt using Level 1 quoted prices in active markets for the publicly traded debt... -
Page 58
... the Kraft Foods Group, Inc. 2012 Performance Incentive Plan (the "2012 Plan"), we may grant eligible employees awards of stock options, stock appreciation rights, restricted stock and restricted stock units ("RSUs") as well as performance based long-term incentive awards ("Performance Shares"). In... -
Page 59
...in 2012. The unamortized compensation expense related to our outstanding stock options was $17 million at December 28, 2013 and is expected to be recognized over a weighted average period of two years. Our weighted average Black-Scholes fair value assumptions were as follows: Risk-Free Interest Rate... -
Page 60
... market value of $65 million. International stock-based compensation Prior to the Spin-Off, our employees participated in various plans. As such, we were allocated stock-based compensation expense of $39 million in 2012 and $51 million in 2011 associated with these plans. In connection with the Spin... -
Page 61
...These plans cover most salaried and certain hourly employees, and their cost is charged to expense over the working life of the covered employees. Pension Plans Obligations and Funded Status: The projected benefit obligations, plan assets, and funded status of our pension plans at December 28, 2013... -
Page 62
... 29, 2012 were: U.S. Plans December 28, 2013 December 29, 2012 Non-U.S. Plans December 28, 2013 December 29, 2012 (in millions) Projected benefit obligation Accumulated benefit obligation Fair value of plan assets $ 203 186 17 $ 7,130 6,802 5,460 $ 52 44 - $ 1,319 1,205 975 We used the... -
Page 63
... performance, current and future asset allocation, and estimates of future long-term returns by asset class. Plan Assets: The fair value of pension plan assets at December 28, 2013 was determined using the following fair value measurements: Quoted Prices in Active Markets for Identical Assets (Level... -
Page 64
... - includes primarily pooled funds valued using net asset values of participation units held in common collective trusts, as reported by the managers of the trusts and as supported by the unit prices of actual purchase and sale transactions. Level 2 plan assets also include corporate bonds and other... -
Page 65
... million of corporate bonds and other In connection with the Spin-Off, fixed-income securities and $187 million of real estate which are classified as Level 3 pension assets. The percentage of fair value of pension plan assets at December 28, 2013 and December 29, 2012 was: U.S. Plans Asset Category... -
Page 66
... to multiemployer pension plans of $2 million in 2013 and $1 million in 2012 subsequent to the Spin-Off. These plans provide pension benefits to retirees under certain collective bargaining agreements. We also sponsor and contribute to employee savings plans. These plans cover eligible salaried, non... -
Page 67
... reported for the health care plans. A one-percentage-point change in assumed health care cost trend rates would have the following effects as of December 28, 2013: One-Percentage-Point Increase (in millions) Decrease Effect on annual service and interest cost Effect on postretirement benefit... -
Page 68
...not reflected in our consolidated balance sheets. We provided pension coverage for certain employees of our Canadian operations through separate plans and certain pension and postemployment benefits of our Canadian operations, which were included in our financial statements prior to the Spin-Off. As... -
Page 69
... most of the retired North American International employees. We assumed net benefit plan liabilities of $5.5 billion from International, which was in addition to the $0.1 billion of net benefit plan liabilities we had previously reported in our historical financial statements, for a total liability... -
Page 70
... prices in active markets for identical assets and liabilities. Level 2 financial assets and liabilities consist of commodity forwards and foreign exchange forwards. Commodity derivatives are valued using an income approach based on the observable market commodity index prices less the contract rate... -
Page 71
.../ gains, net of income taxes, reclassified from accumulated other comprehensive earnings / (losses) into net earnings were: For the Years Ended December 28, 2013 December 29, 2012 (in millions) December 31, 2011 Commodity contracts Foreign exchange contracts Interest rate contracts Total $ $ (26... -
Page 72
...in Chicago, Illinois, and on November 12, 2013, the arbitrator issued a decision awarding us compensation for Starbucks' unilateral termination of the Starbucks Agreement. While we remained the named party in the proceeding, pursuant to the Separation and Distribution Agreement between International... -
Page 73
...2013 December 29, 2012 December 31, 2011 U.S. federal statutory rate Increase / (decrease) resulting from: U.S. state and local income taxes, net of federal tax benefit excluding IRS audit impacts U.S. federal and state reserves on IRS audit settlements Domestic manufacturing deduction Foreign rate... -
Page 74
...effective tax rate included net tax costs of $52 million, primarily due to various U.S. federal and state tax audit developments during the year as well as the revaluation of state deferred tax assets and liabilities resulting from state tax legislation enacted in 2011. Our unrecognized tax benefits... -
Page 75
...28, 2013 December 29, 2012 (in millions) Deferred income tax assets: Pension benefits Postretirement benefits Other employee benefits Other Total deferred income tax assets Valuation allowance Net deferred income tax assets Deferred income tax liabilities: Trade names Property, plant and equipment... -
Page 76
...28, 2013 Affected Line Item in the Statement Where Net Income is Presented Derivative hedging (gains) / losses Commodity contracts Foreign exchange contracts Interest rate contracts Total before tax Tax expense Net of tax Postemployment benefit plan adjustments Amortization of prior service credits... -
Page 77
...the Spin-Off. Note 15. Segment Reporting We manufacture and market food and beverage products, including refrigerated meals, refreshment beverages, coffee, cheese, and other grocery products, primarily in the United States and Canada. Effective July 1, 2013, we began managing and reporting operating... -
Page 78
...2011 Earnings before income taxes: Operating income: Beverages Cheese Refrigerated Meals Meals & Desserts Enhancers & Snack Nuts Canada Other Businesses Unrealized gains / (losses) on hedging activities Certain postemployment benefit plan income / (costs) General corporate expenses Operating income... -
Page 79
... income taxes, prepaid pension assets, and derivative financial instrument balances. For the Years Ended December 28, 2013 December 29, 2012 (in millions) December 31, 2011 Depreciation Expense: Beverages Cheese Refrigerated Meals Meals & Desserts Enhancers & Snack Nuts Canada Other Businesses... -
Page 80
... procedures (as defined in Exchange Act Rule 13a-15(e)) as of the end of the period covered by this report. Based upon that evaluation, our CEO and CFO concluded that our disclosure controls and procedures were effective as of December 28, 2013. Internal Control Over Financial Reporting and Changes... -
Page 81
... an independent registered public accounting firm, who audited the consolidated financial statements included in this Annual Report on Form 10-K, has also audited the effectiveness of our internal control over financial reporting as of December 28, 2013 as stated in their report which appears herein... -
Page 82
... market price of Kraft common stock on the date of purchase. Under this plan, we do not intend to issue new shares, but purchase the shares from the open market. Information related to the security ownership of certain beneficial owners and management is included in our 2014 Proxy Statement under... -
Page 83
... and Financial Statement Schedules. (a) Index to Consolidated Financial Statements and Schedules Page Report of Independent Registered Public Accounting Firm Consolidated Statements of Earnings for the Years Ended December 28, 2013, December 29, 2012, and December 31, 2011 Consolidated Statements... -
Page 84
... Information Technology Transition Services Agreement between Kraft Foods reference to Exhibit 10.10 to Amendment No. 2 to our Registration Statement on Form S-4 filed with the SEC on December 4, 2012 (File No. 333-184314)).* 10.6 Kraft Foods Group, Inc. Change in Control Plan for Key Executives... -
Page 85
... 10.15 to our Annual Report on Form 10-K filed with the SEC on March 21, 2013 (File No. 333-35491).+ Form of Kraft Foods Group, Inc. 2012 Performance Incentive Plan Global Restricted Stock Unit Agreement (incorporated by reference to Exhibit 10.16 to our Annual Report on Form 10-K filed with the SEC... -
Page 86
...15(d) of the Securities Exchange Act of 1934, the registrant has duly caused this report to be signed on its behalf by the undersigned, thereunto duly authorized. KRAFT FOODS GROUP, INC. /s/ Teri List-Stoll Teri List-Stoll Executive Vice President and Chief Financial Officer Date: February 21, 2014... -
Page 87
... Other Expenses Accounts (a) Col. D Col. E Balance at End of Period Description Deductions (b) 2013: Allowances related to accounts receivable Allowance for deferred taxes 2012: Allowances related to accounts receivable Allowance for deferred taxes 2011: Allowances related to accounts receivable... -
Page 88
...B.V. Kraft Foods Group Puerto Rico LLC Kraft New Services, Inc. Nature's Delicious Foods Group LLC OMFC Service Company Perdue Trademark Subsidiary, Inc. Phenix Management Corporation Pollio Italian Cheese Company Seven Seas Foods, Inc. The Heritage Cemetery Association The Yuban Coffee Company Vict... -
Page 89
... Kraft Foods Group, Inc. of our report dated February 21, 2014 relating to the financial statements, financial statement schedule and the effectiveness of internal control over financial reporting, which appears in this Annual Report on Form /s/ PricewaterhouseCoopers LLP Chicago, Illinois February... -
Page 90
...and report financial information; and (b) Any fraud, whether or not material, that involves management or other employees who have a significant role in the registrant's internal control over financial reporting. Date: February 21, 2014 /s/ W. Anthony Vernon W. Anthony Vernon Chief Executive Officer... -
Page 91
...in the design or operation of internal control over financial reporting which are reasonably likely to adversely affect the registrant's ability to record, process, summarize and report financial information; and (b) Any fraud, whether or not material, that involves management or other employees who... -
Page 92
... and that the information contained in Kraft's Annual Report on Form 10-K fairly presents, in all material respects, Kraft's financial condition and results of operations. /s/ Teri List-Stoll Teri List-Stoll Executive Vice President and Chief Financial Officer February 21, 2014 A signed original of...